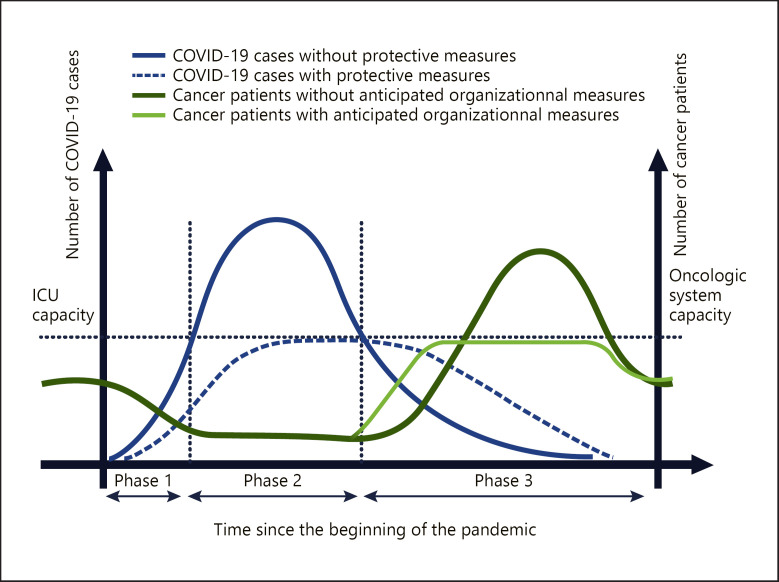
Fig. 1.
From left to right, the blue curve shows the increase and decrease in the number of infected cases during the 3 phases of the outbreak. During phases 1 and 2, the risk is a shortage of intensive care beds, and the goal of the health authorities is to flatten the growing curve of the virus (curve in blue dots). During this time, cancer patients cannot be treated, which is represented by a decrease in the green curve during the first 2 phases. A waiting list of cancer patients develops during this period. In the absence of anticipatory measures, the capacity of the oncological system will be overwhelmed by the massive influx of cancer patients from the waiting list but also from the normal flow. The objective is to flatten the curve by taking adaptive measures with the aim of not altering the prognosis of cancer patients. The possible second wave of the epidemic has not been represented on these curves. The area under the curve for the light green and dark green curves should be considered as equal.

