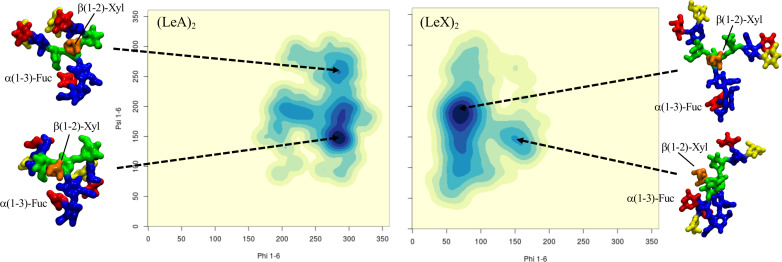
Figure 4.
Comparison of the different conformational equilibria of the (1-6) arm in a core α(1-3)-Fuc β(1-2)-Xyl A2 N-glycan with terminal LeA and LeX groups on the left- and right-hand side, respectively. Representative structures from 1.5 μs MD sampling of each system are shown to illustrate the conformations corresponding to the different minima. The N-glycans structures are shown with the (1-3) and (1-6) arms on the left and on the right, respectively. The monosaccharides colouring follows the SFNG nomenclature. The structure rendering was done with VMD (https://www.ks.uiuc.edu/Research/vmd/) and the graphical statistical analysis with RStudio (https://www.rstudio.com).

