
FIGURE 3.
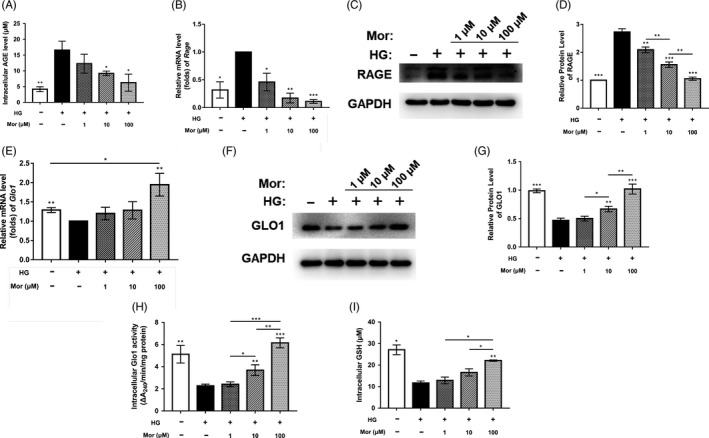
Morroniside inhibits AGE‐RAGE signalling and activates Glo1. A, Intracellular level of AGEs was evaluated by ELISA. B‐D, Gene and protein expression of RAGE was assessed by qRT‐PCR (B) and Western blot (C, D) at day 7 after treatment. E‐G, Gene and protein expression of Glo1 was determined by qRT‐PCR (E) and Western blot (F, G) at day 7. H and I, Glo1 activity was measured by Glo1 activity assays (H) and a GSH detection assay (I). The data were confirmed by three repeated tests and are presented as the means ± SD. Mor, morroniside. HG, high glucose. *P < .05 compared with high glucose treatment group; **P < .01; ***P < .001