
FIGURE 5.
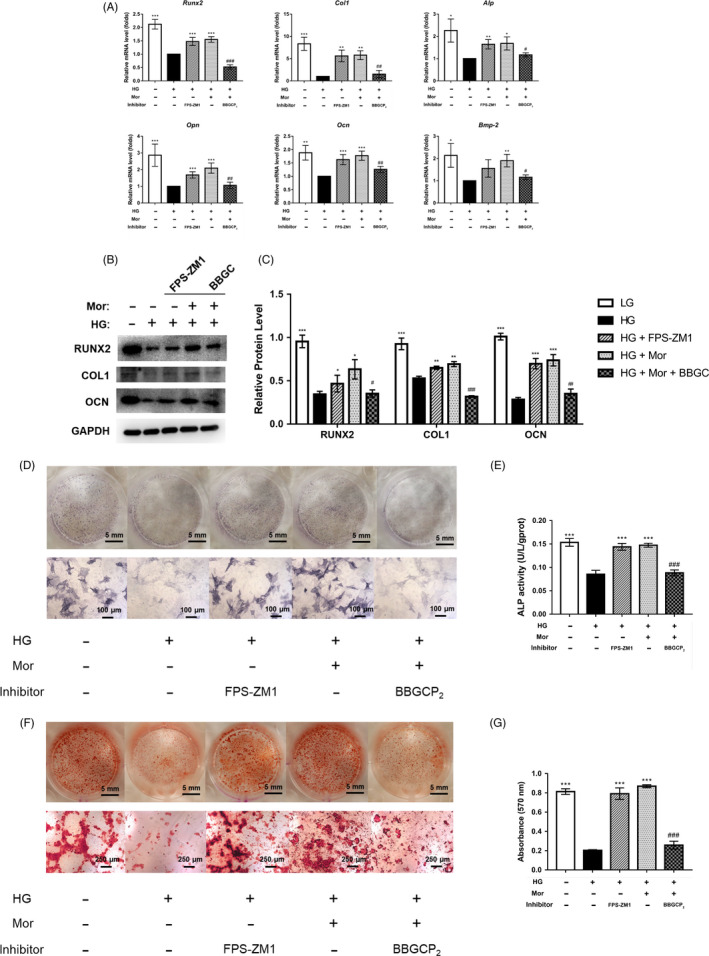
Increased osteogenesis of BMSCs induced by morroniside treatment under high glucose conditions is partially inhibited by BBGCP2. A‐C, Expression of osteogenic‐specific genes and proteins was assessed by qRT‐PCR (A) and Western blot (B, C) at day 7 of osteogenic differentiation. D‐G, Osteogenesis was determined by ALP staining (D), ALP activity assays (E) and Alizarin Red staining (F). Calcium deposition was assessed by measuring the optical density (G). The data were confirmed by three repeated tests and are presented as the means ± SD. Mor, morroniside. HG, high glucose. FPS‐ZM1, an inhibitor of RAGE signalling. BBGC, BBGCP2. *P < .05 compared with the high glucose treatment group; **P < .01; ***P < .001. #P < .05 compared with the morroniside treatment group; ##P < .01; ###P < .001