
FIGURE 7.
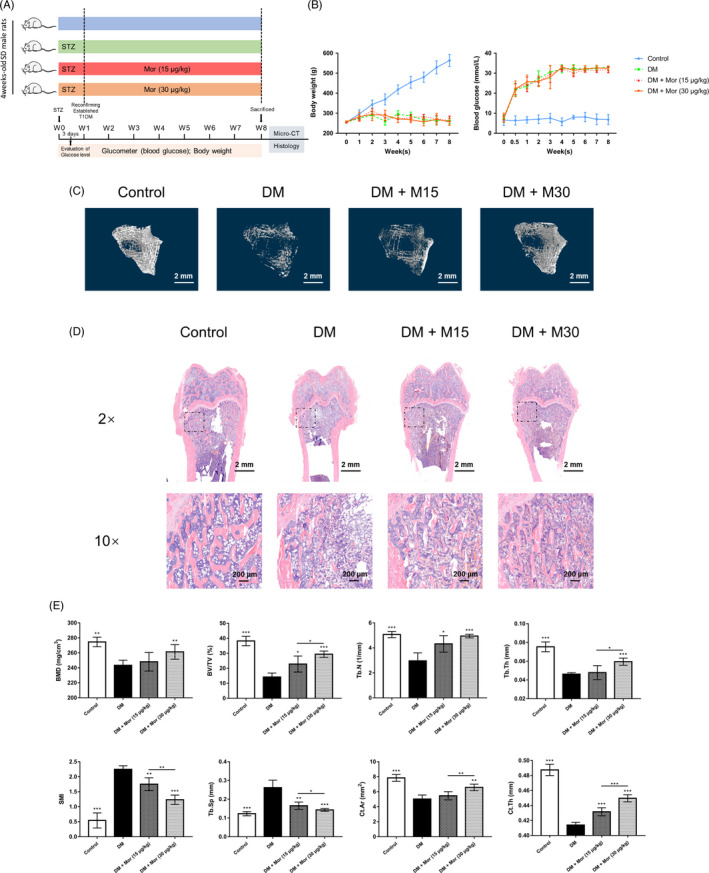
Morroniside promotes bone mineral density and improves bone microarchitecture in a rat type 1 diabetes model. A, Experimental design illustrating the time points for inducing diabetes by STZ, establishing T1DM and collecting parameters, as well as the timing and dose of morroniside administration in the animal model. B, Weight and serum glucose levels of rats during the experiment. C, Microcomputed tomography–generated three‐dimensional reconstruction images of the trabecular bone at the distal femur in each group. D, Representative images of H&E staining in sections of the rat distal femur, at magnifications of 20 × and 100×. E, Micro‐CT analyses of bone mineral density (BMD), bone volume/total volume (BV/TV), trabecular number (Tb.N), trabecular thickness (Tb.Th), structure model index (SMI), trabecular separation (Tb.Sp), cortical bone area (Ct.Ar) and cortical thickness (Ct.Th). The data were confirmed by three repeated tests and are presented as the means ± SD. Mor, morroniside. M15, 15 μg/kg morroniside treatment. M30, 30 μg/kg morroniside treatment. *P < .05 compared with the DM group; **P < .01; ***P < .001