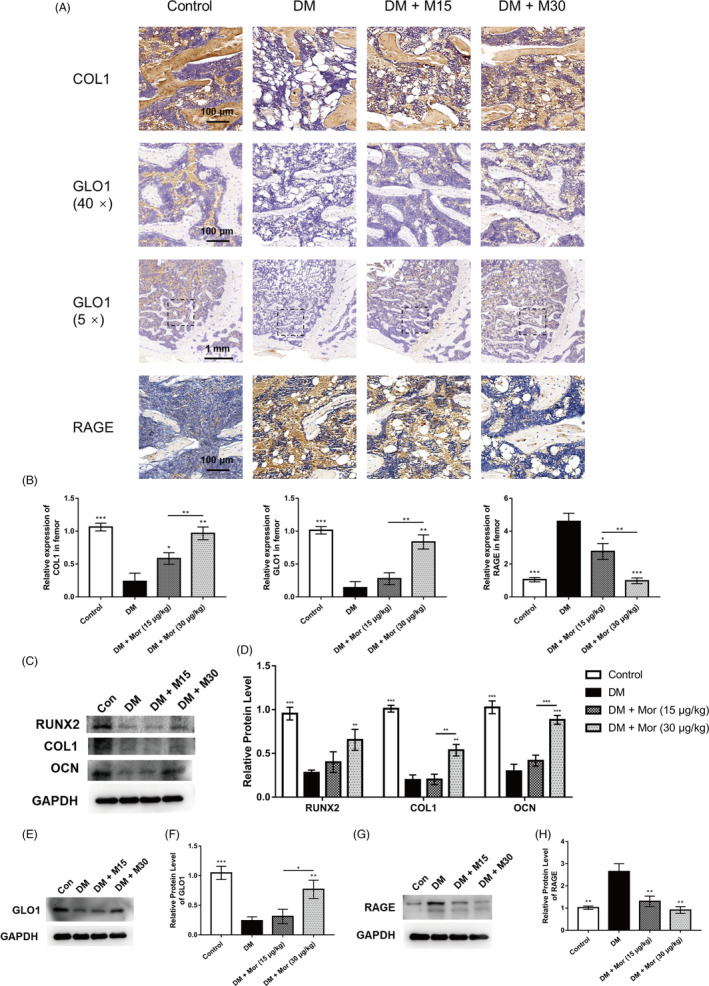
FIGURE 8.

Morroniside restores the expression of RAGE and osteogenic markers to control levels in type 1 diabetes rat model. A and B, Immunohistological analysis of COL1, GLO1 and RAGE in the rat distal femur; magnification at 400 × and 50×. C and D, Expression of osteogenic‐specific proteins were assessed by Western blot. E and F, Expression of GLO1 was measured by Western blot. G and H, Expression of RAGE was measured by Western blot. The data were confirmed by three repeated tests and are presented as the means ± SD. Mor, morroniside. M15, 15 μg/kg morroniside treatment. M30, 30 μg/kg morroniside treatment. *P < .05 compared with the DM group; **P < .01; ***P < .001
