
FIGURE 3.
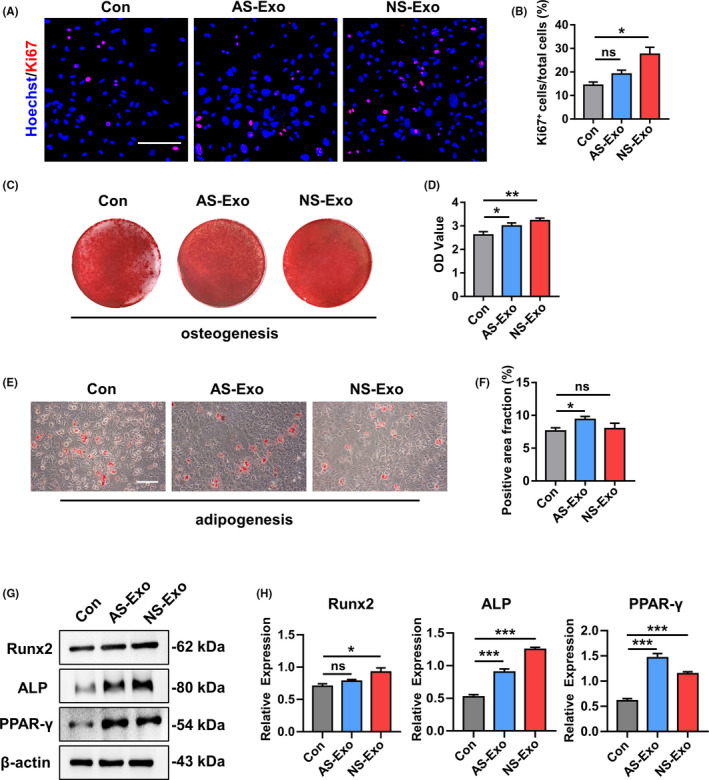
The representative images of Ki‐67 staining (A) and quantified by the positive‐stained percentage through ImageJ software (B). Scale bar, 100 μm. (C‐D) Alizarin Red staining was performed to detect mineralized nodules formed in Con, AS‐Exo and NS‐Exo 14 days after osteogenic induction and quantified with a spectrophotometer after dissolving with cetylpyridinium chloride. (E‐F) Lipid droplet formation was detected by Oil Red O staining 7 days after adipogenic induction with positive area quantified. Scale bar, 100 μm. (G‐H) The protein expression levels of Runx2, ALP and PPAR‐γ in Con, AS‐Exo and NS‐Exo groups were measured through Western blot and quantified by ImageJ software. n = 3 per group. Data are shown as mean ± SD; ns, not significant; *P < .05; **P < .01; ***P < .001. AS‐Exo, adult serum exosomes; Con, control; NS‐Exo, neonatal serum exosomes