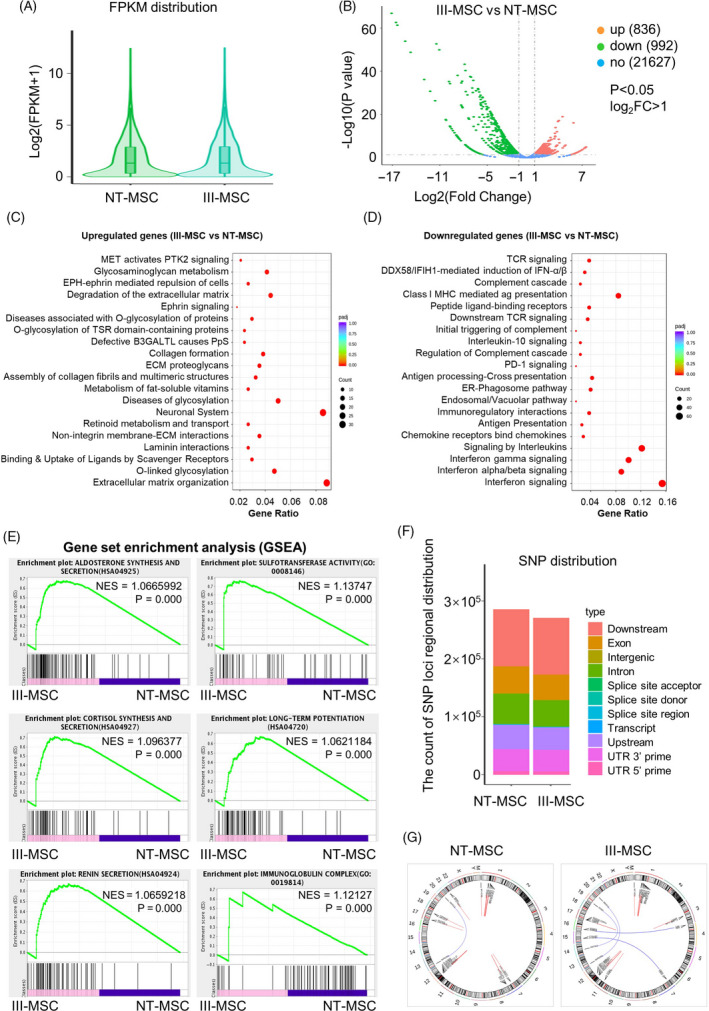
FIGURE 2.

The distribution of differentially expressed genes and mutation spectrum in NT‐mesenchymal stem/stromal cells (MSCs) and III‐MSCs. A, Gene expression distribution of total genes in the genome of NT‐ and III‐MSCs. B, Volcano plot analysis of total genes. C and D, GO analysis of upregulated (C) and downregulated (D) genes (P < .05, log2 FC > 1). E, GSEA shows enrichment plot of the indicated subsets in NT‐ and III‐MSCs. F and G, Distribution of SNPs (F) and fusion genes (G) in the genome of NT‐ and III‐MSCs
