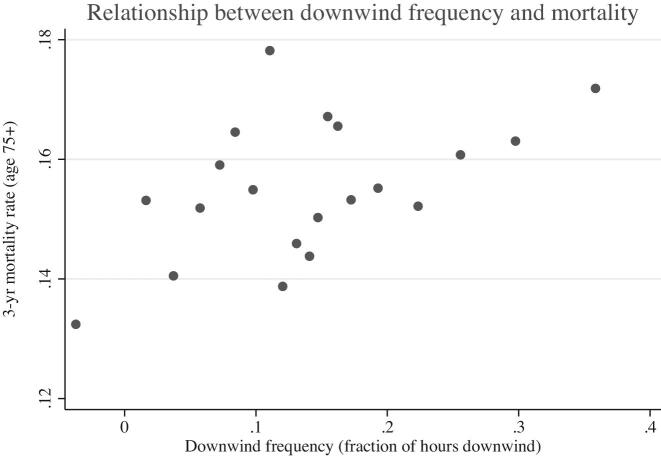
Figure 4.
Relationship between downwind frequency and mortality. This figure plots a bin scatterplot of the three-year mortality rate for 75+ year olds against downwind frequency. Variables are residualized with respect to 800-m highway segment fixed effects. Each bin contains approximately 500 observations.

