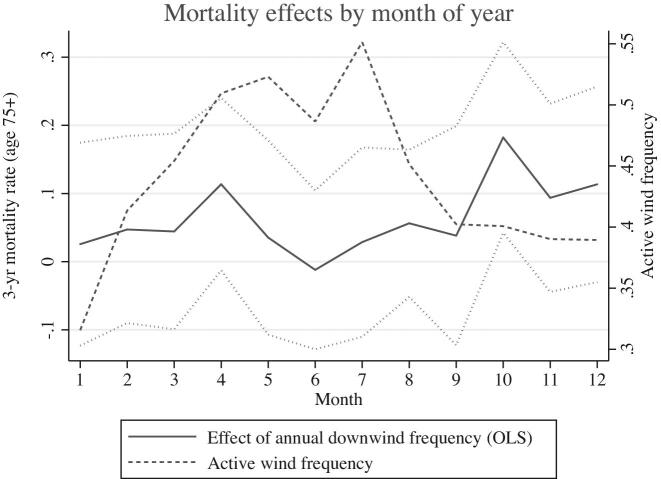
Figure 6.
Mortality effects by month of year. This figure plots regression coefficients or means estimated by month of year. The solid line plots coefficients from a regression of monthly mortality rates on overall downwind frequency, controlling for distance to highway, weather station fixed effects, highway segment fixed effects, share African-American, and share over ages 50, 55, 60, 65, 70, and 75. The dashed line plots the sample-weighted share of month during which wind blows at under 1 mph.

