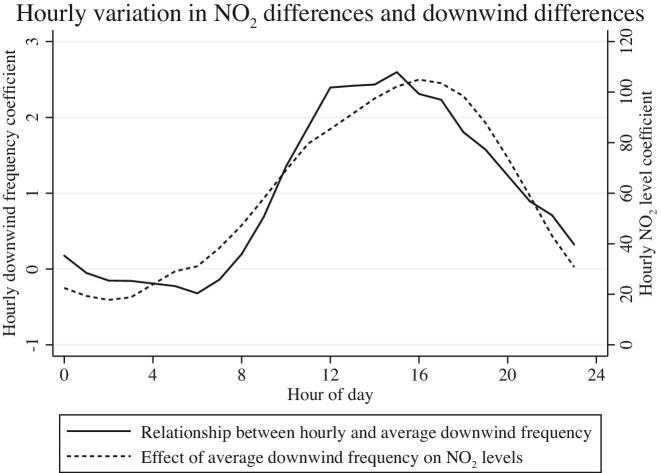
Figure 8.
Hourly variation in NO2 differences and downwind differences. This figure plots regression coefficients from regressions of hourly downwind frequency on average downwind frequency (solid line) or regressions of NO2 concentrations on average downwind frequency (dashed line). Each regression is limited to a single hour of day, and in all regressions the unit of observation is a single pollution reading at one monitor.

