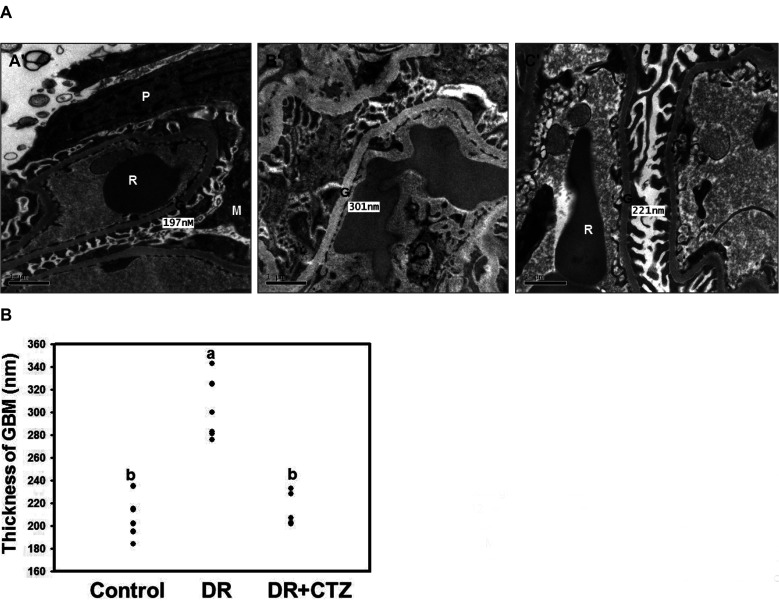
Fig. 1. Electron micrographs of representative kidney sections from the experimental groups.
(A) Panel A’, control group; Panel B’, STZ-induced diabetic group; and Panel C’, STZ + 5 mg/kg/day of CTZ group treating for 12 weeks (6 rats per group); (B) quantification of thickness of glomerular basement membrane (GBM). All the figures are 20,000× magnification. Mean values within each column with different labels (a, b) are significantly different (p < 0.05). CTZ, cilostazol; STZ, streptozotocin; P, podocyte; G, GBM; M, mesangium; R, red blood cell; DR, diabetic rats.

