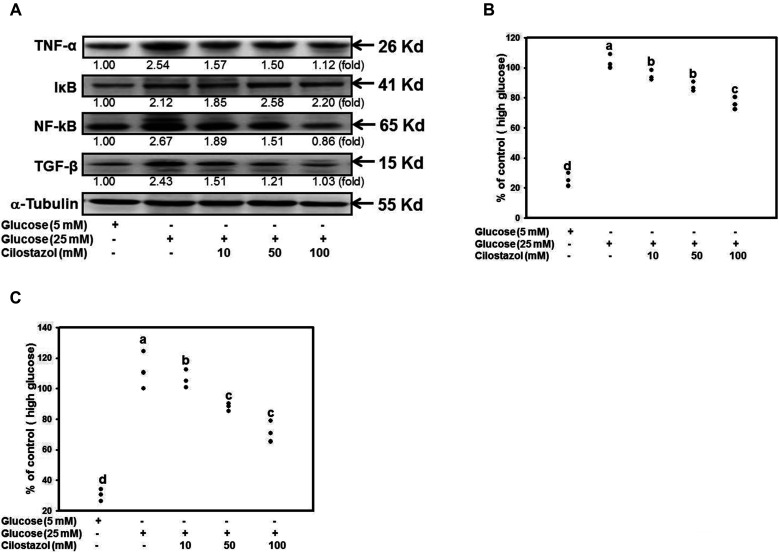
Fig. 7. CTZ decreases the level of NF-κB, TGF-β and TNF-α.
RMC cell was exposed to high glucose and variable concentration of CTZ. (A) The protein level of cellular TNF-α, TGF-β, IkB and NF-κB p65 were analyzed by immunoblot, the quantitative determination were normalized to the group of 5 mM glucose. The level of secreted (B) TGF-β and (C) TNF-α were determined by ELISA; the results were expressed as the mean ± standard deviation of three determinations and all data were normalized to the group of high glucose represented as 100%. Mean values within each column with different labels (a–d) are significantly different (p < 0.05). CTZ, cilostazol; RMC, rat mesangial cell.

