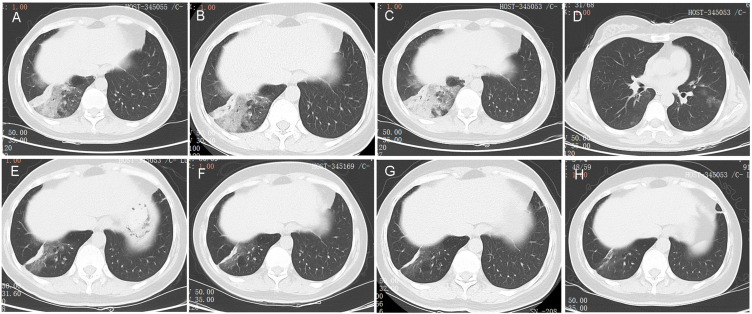
Figure 1.
Computed tomography (CT) images of the patient during the whole diagnosis and treatment procedure. (A) CT images showing the infiltrations on the lower right lung at the patient’s first visit on May 25; (B) CT images on June 7 showing a slightly progressed lesion on the lower right lung after moxifloxacin treatment. (C) CT images on July 27 showing marked progressed lesion on the lower right lung after voriconazole treatment. (D) CT images on July 27 showing a new ground grass opacity on the lower left lung. (E) CT images showing a significant reduced lesion on the lower right lung after 2 months of anti-tumor therapy. (F) CT images showed that the lesion on right lower lung continued to shrink after 4 months of anti-tumor therapy. (G) CT images showed that the lesion on right lower lung was reduced further after 7 months of anti-tumor therapy. (H) CT images showed that only a few ground glass shadows and fibrous lesions remained on the right lower lung after 10 months of anti-tumor therapy.

