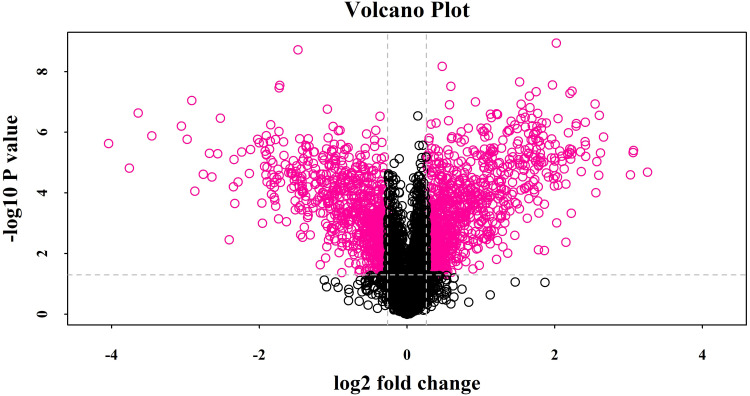
Figure 1.
Volcano plot showing log2 fold change plotted against -log10 adjusted P value for ESBLs+ Klebsiella pneumoniae samples versus non-ESBL Klebsiella pneumoniae samples. Data points in the upper right (fold change > 1.2) and upper left (fold change < 0.83) sections with P<0.05 represent proteins that are significantly different in ESBLs+ Klebsiella pneumoniae compared with non-ESBL Klebsiella pneumoniae.

