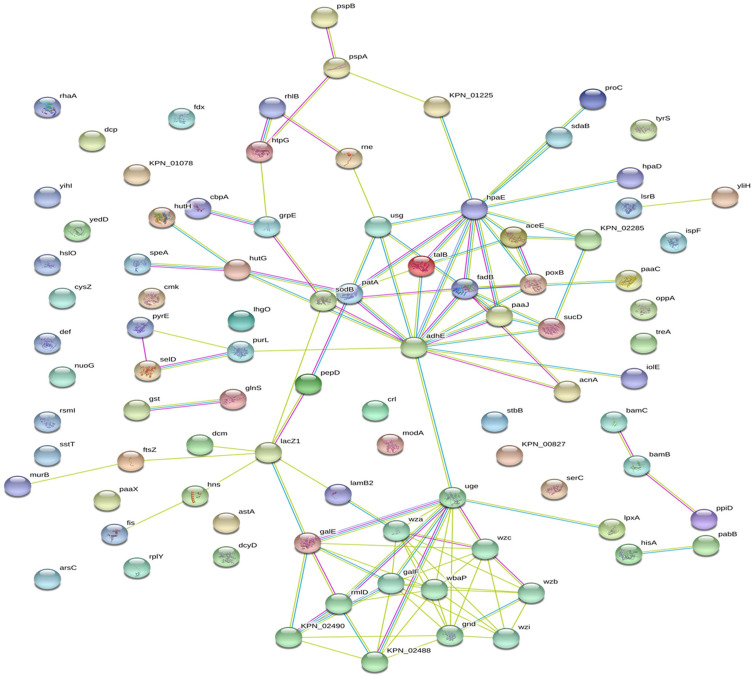
Figure 3.
Differentially expressed proteins were combined to build a regulatory network by STRING. The differentially expressed proteins are represented as nodes, and the relationship between two nodes is represented as an edge. The empty nodes represent the proteins of unknown 3D structure, while the filled nodes indicate that some 3D structure is known or predicted. The interaction information between proteins from curated databases is represented by an blue edge; experimentally determined: purple edge; predicted interactions: cyan edge; and textming: lawn green edge. The network contained 90 nodes and 115 edges with an average node degree of 2.56 and a clustering coefficient of 0.421. The PPI enrichment p-value was equal to 8.58e-07.

