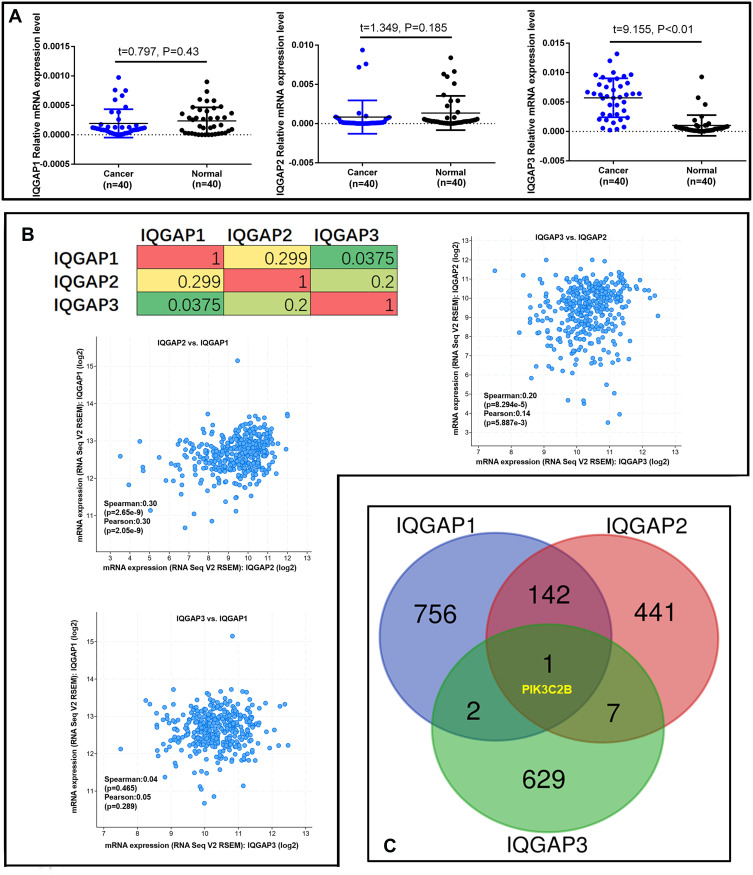
Figure 2.
IQGAP gene expression and frequently altered neighbouring gene analysis in CRC (cBioPortal). (A) Real-time PCR analysis of IQGAP gene expression in 40 paired CRC tissues. P<0.05 was significant. (B) Correlations of IQGAPs with each other by analysing their mRNA expression (RNA Seq V2 RSEM) via the cBioPortal online tool for CRC (TCGA, Provisional). (C) The Venn diagram results show that PIK3C2B is positively associated with IQGAP alterations in CRC.
Abbreviation: t, t value.

