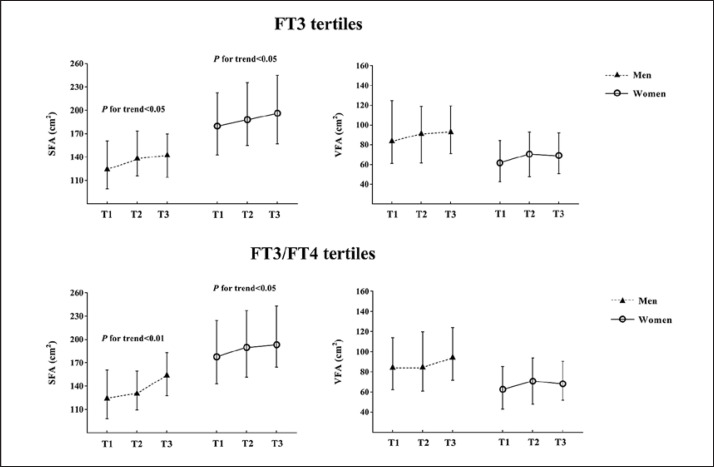
Fig. 1.
Relationships of SFA and VFA with FT3 and FT3/FT4 tertiles. Small triangles or circles indicate the median, and the two bars indicate the interquartile range. FT3 tertiles: T1 <5.02 pmol/L, T2 5.02–5.38 pmol/L, and T3 >5.38 pmol/L for men; T1 <4.57 pmol/L, T2 4.57–4.93 pmol/L, and T3 >4.93 pmol/L for women. FT3/FT4 tertiles: T1 <0.29, T2 0.29–0.33, and T3 >0.33 for men; T1 <0.27, T2 0.27–0.31, and T3 >0.31 for women. The Kruskal-Wallis H test was used for trend analysis.

