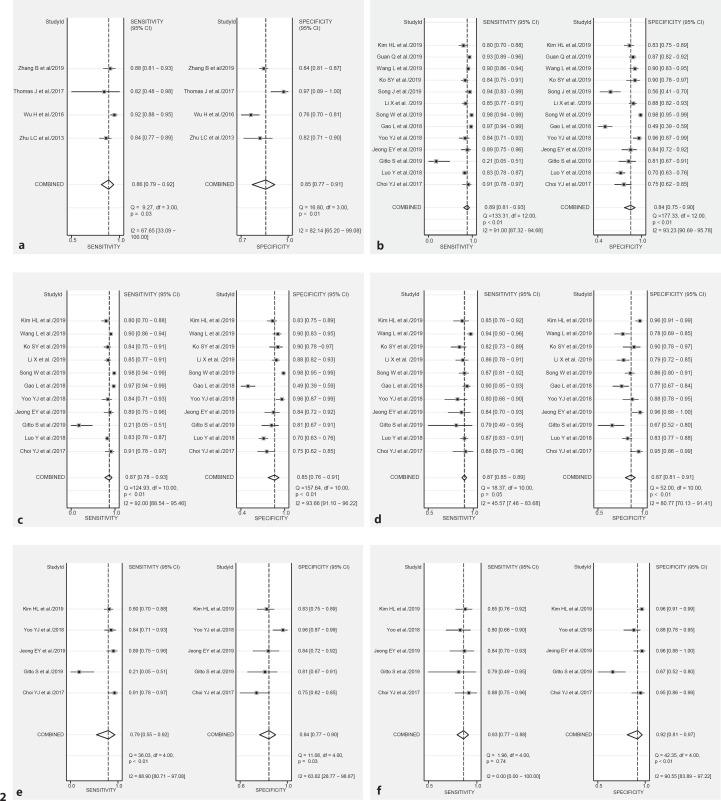
Fig. 2.
Forest plots of computer-aided diagnosis (CAD) systems and the radiologist counterparts. The sensitivity and specificity of the individual studies are represented by gray squares, and the pooled results are represented by rhombi. The confidence interval (CI) is indicated by error bars. a Diagnostic performance of classic machine learning-based CAD systems: AUC 0.93 (95% CI 0.90–0.95) and DOR 37.41 (95% CI 24.91–56.20). b Diagnostic performance of deep learning-based CAD systems: AUC 0.93 (95% CI 0.90–0.95) and DOR 40.87 (95% CI 18.13–92.13). c, d Comparison between deep learning-based CAD systems (c) and radiologists (d): AUC 0.93 (95% CI 0.90–0.95) versus 0.92 (95% CI 0.89–0.94) and DOR 40.12 (95% CI 15.58–103.33) versus 44.88 (95% CI 30.71–65.57). e, f Comparison between deep learning-based real-time CAD systems (e) and radiologists (f): AUC 0.88 (95% CI 0.85–0.91) versus 0.88 (95% CI 0.85–0.91) and DOR 19.82 (95% CI 5.92–66.35) versus 55.93 (95% CI 17.72–176.54).

