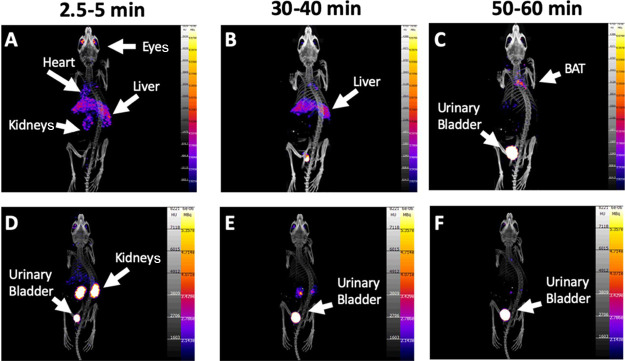
Figure 2.
Maximum intensity projections of PET images from NBA (upper row, group A1) and biotin-challenged (lower row, group A3) mice at (A, D) 2.5–5 min, (B, E) 30–40 min, and (C, F) 50–60 min post [11C]biotin IV injection. Tracer uptake is reduced in the biotin-challenged mice in the BAT, liver, heart, and eyes. PET images are displayed according to the intensity scale for the tracer activity, from white (highest) through red (intermediate) to purple (lowest).

