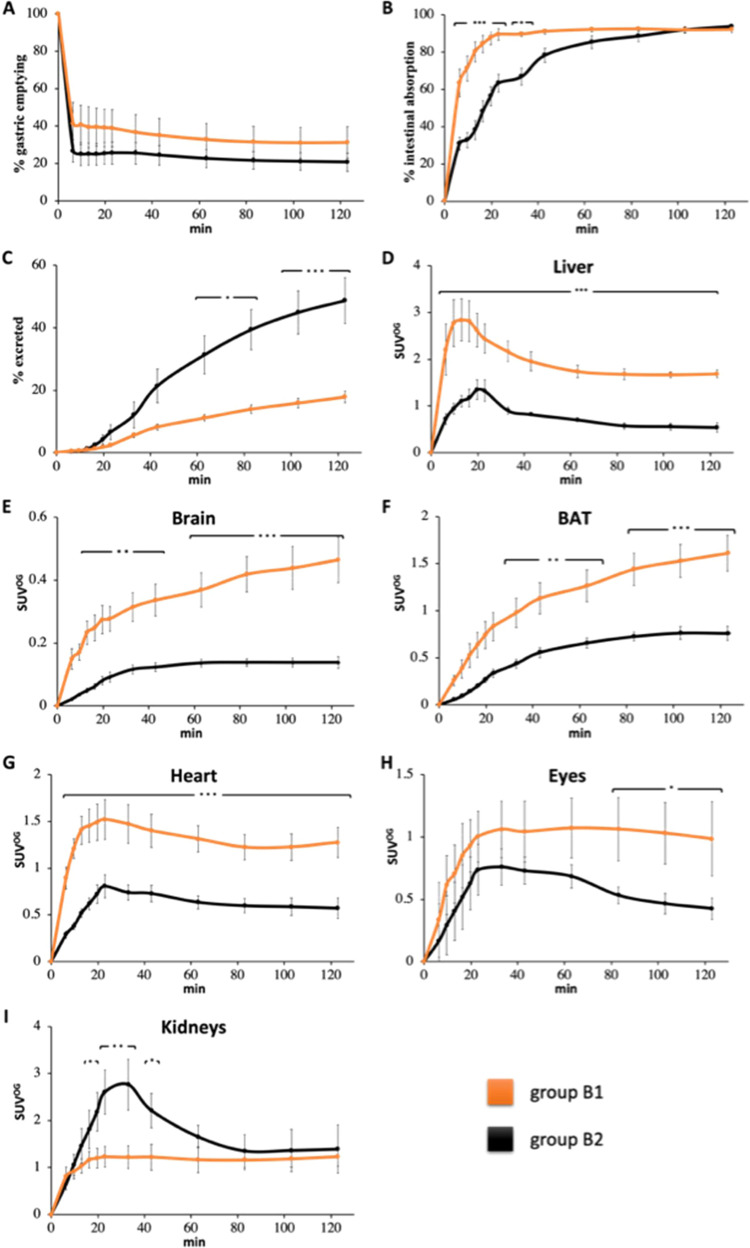
Figure 3.
(A) Time (0–120 min)–% gastric emptying profile, (B) time–% intestinal absorption profile, (C) time–% excretion profile, and time–SUVOG profile for (D) liver, (E) brain, (F) BAT, (G) heart, (H) eyes, and (I) kidneys in NBA (orange line, group B1) and biotin-challenged (black line, group B2) mice receiving [11C]biotin OG. Data are the mean ± SEM. Note that the y-scale (SUVOG) varies between different tissues.

