
Figure 2.
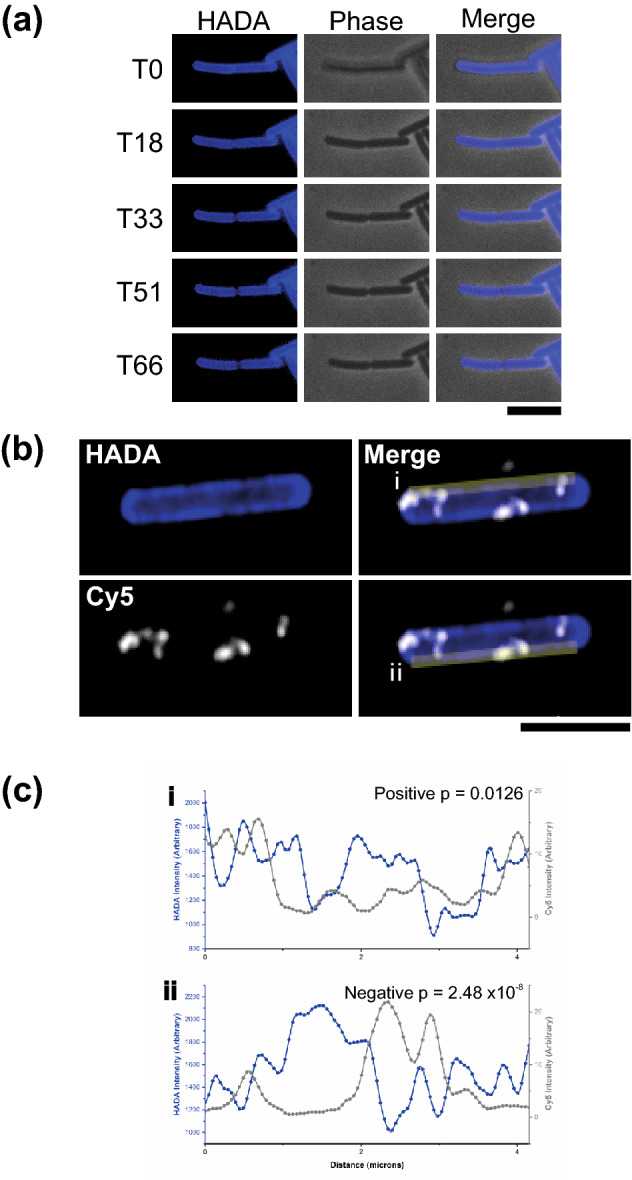
New surface S-layer colocalizes with areas of new peptidoglycan synthesis. (a) Examples of timepoints from real-time widefield fluorescent HADA signal (left panels) and phase contrast (center panels) of C. difficile 630 cells chased for HADA stain. Frame time represented in minutes, scale bar indicates 6 µm. (b) Airyscan confocal image of a C. difficile 630 cell grown with HADA to label peptidoglycan (Blue) and chased to reveal darker areas of newly synthesized peptidoglycan in the cell wall. This chase was followed by a short expression of SlpAR20291 which was specifically immunolabeled with Cy5 (White). After merging HADA and Cy5 channels (righthand panels, duplicated for clarity), cell sides (yellow bars) were selected for signal intensity analysis. For this example cell the intensity plots for cell sides (i) and (ii) are shown in panel C. Scale bar indicates 6 µm. (c) Intensity plot depicting signal from HADA (Blue) and Cy5 (Grey) along the yellow bars illustrated in (b). Trace (i) was calculated to have a significant positive correlation and (ii) a significant negative correlation.