Figure 5.
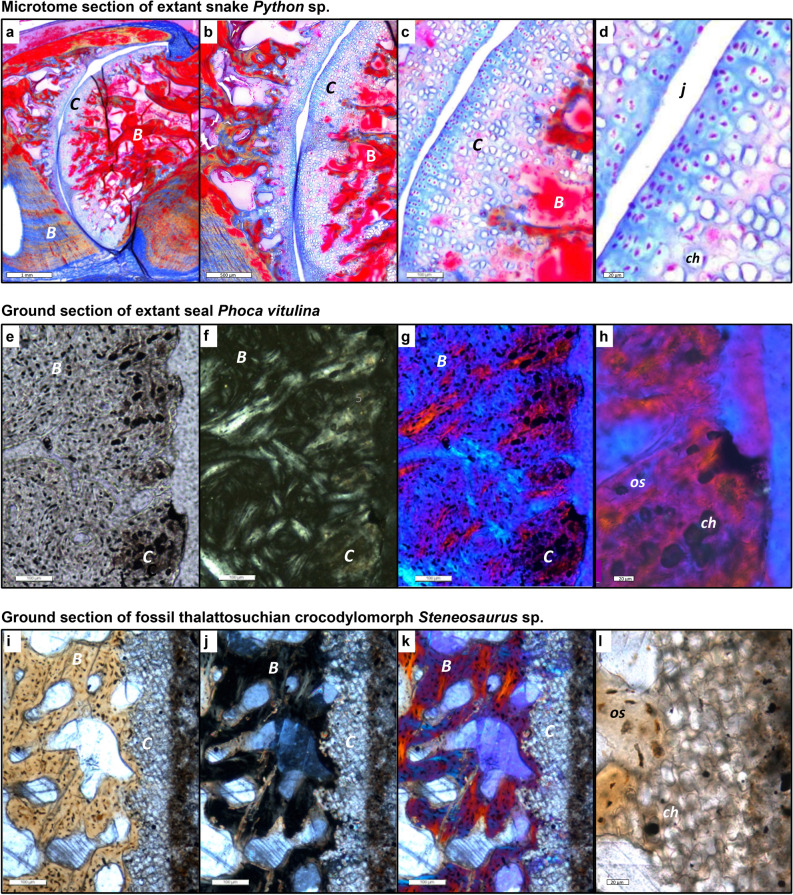
Intervertebral articular cartilage in extant and fossil amniotes and different types of sectioning and light microscopy. (a–d) Microtome section stained with Azan of extant joint with cartilage of extant snake Python sp. IGPB R 662, synovial ball-and-socket joint at increasing magnifications in normal transmitted light. Blue is cartilage and other connective tissues, red is bone. Note the serial cartilage, i.e., the arrangement of the cartilage cells in files, especially in (c). (d) Cartilage layer with differentiating (left) and hypertrophied (right) cartilage cells, note the size increase from left to right and the globular shape of the hypertrophied chondrocytes, as in (h) and (l). (e–h) Ground section of extant seal Phoca vitulina IGPB M 60, joint with IVD, peripheral area of articular surface. (e) Section in normal transmitted light. (f) Section in cross-polarised light. (g) Cross-polarised light and lambda filter. (h) Close-up of g. (i–l) Ground section of fossil thalattosuchian crocodilomorph Steneosaurus IGPB R 663, joint with IVD, peripheral area of articular surface. (i) Section in normal light. (j) Section in cross-polarised light. (k) Cross polarised light and lambda filter. (l) Close-up of (i). Note that the fossil cartilage does not show the same birefringence as the bone. B bone tissue, C cartilage, ch chondrocyte, j joint space, os osteocyte.

