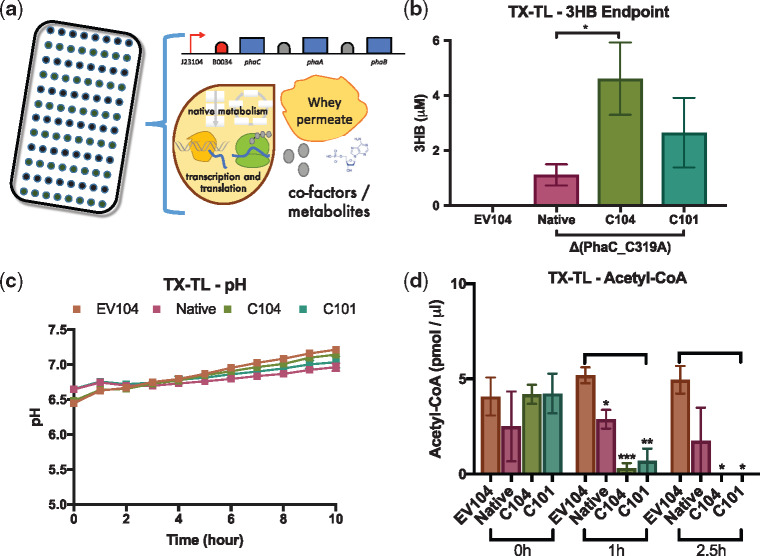
Figure 2.
Cell-free characterization of phaCAB biosynthetic operons. (a) Schematic of whey permeate enhanced cell-free transcription–translation reactions for prototyping phaCAB operons. (b) Endpoint (5 h) GC-MS analysis of 3HB production in cell-free phaCAB operon prototyping reactions. (c) Time-course analysis of pH in cell-free phaCAB prototyping reactions. (d) Endpoint analysis of Acetyl-CoA content in cell-free phaCAB prototyping reactions. Error bars denote standard error of the mean. Student’s t-test, *P < 0.05, **P < 0.01 and ***P < 0.0001, n = 3–9.

