Figure 3.
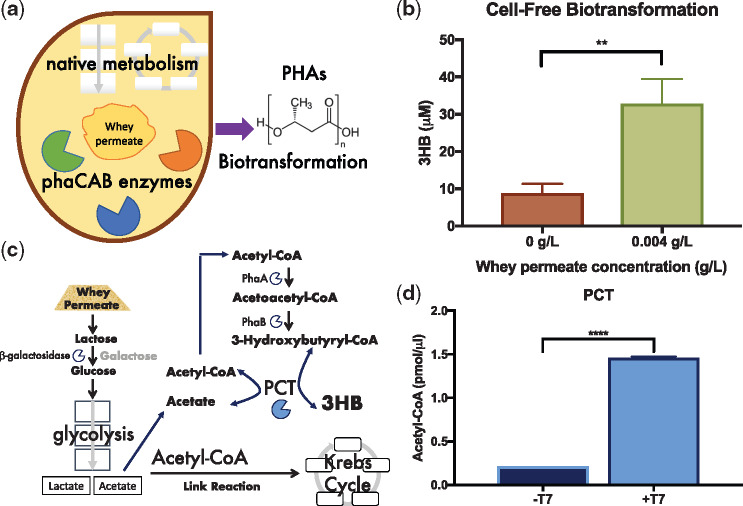
Coupled cell-free biotransformation and transcription–translation reactions (a) Schematic of whey permeate enhanced cell-free biotransformation reactions. (b) Endpoint (5 h) GC-MS analysis of 3HB production in cell-free biotransformation reactions. (c) Schematic depicts the Acetyl-CoA recycling activity of propionyl CoA transferase (PCT) within the context of whey permeate metabolism in cell extracts. (d) End point (2.5 h) analysis of Acetyl-CoA content in coupled cell-free biotransformation and transcription–translation reactions. These reactions also included a T7 inducible pct expression plasmid with (+T7) or without (−T7) T7 RNA polymerase. Error bars denote standard error of the mean. Student’s t-test, **P < 0.01 and ****P < 0.0001, n = 3–6.

