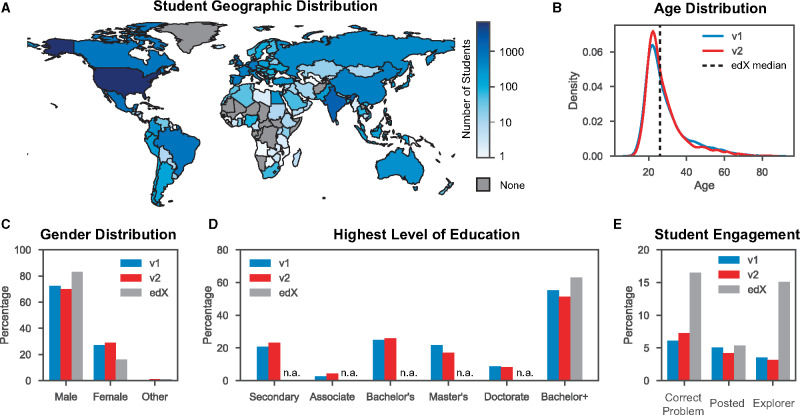
Figure 3.
Course demographics and engagement metrics. (A) Counts of the total number of participating students from each country shown on a logarithmic scale. Countries with no students are grey. (B) Age distribution for both runs of the course. The median age for edX STEM courses is indicated with a dashed line. (C) The self-identified gender distributions of v1 and v2 of the course alongside edX STEM median gender values. (D) The highest level of education indicated by students. Cumulative edX data were only available for the Bachelor+ category (Bachelor, Masters and/or PhD). (E) Percentages of students that correctly answered at least one problem (‘Correct Problem’), made at least one post in the discussion board (‘Posted’), and viewed more than 50% of the course content (‘Explorer’). Median values for edX STEM course are displayed alongside.

