Figure 2.
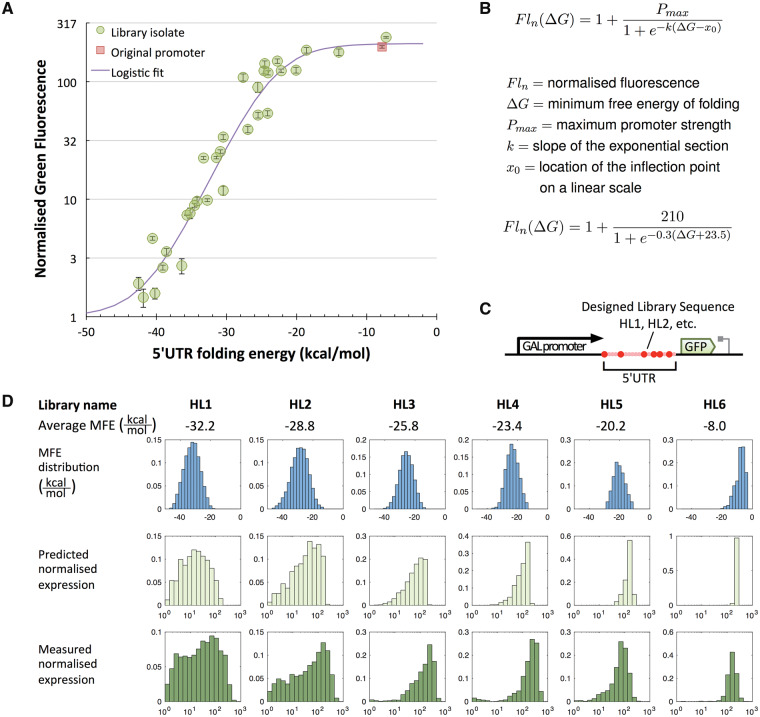
Correlation between 5′UTR hairpin strength and protein expression. Stronger hairpins are shown to cause lower expression in a predictable manner. (A) Determination of the transfer function between hairpin folding energy and normalized green fluorescence. Fluorescence was measured for 31 isolated HL1 and HL2 library members and divided by the median auto fluorescence of the parental strain to obtain the normalized fluorescence. The isolates were sequenced to obtain the 5′UTR sequences, which were used to calculate the corresponding hairpin folding energy. The diagram shows the folding energy of the 5′UTR of each isolate plotted against the normalized green fluorescence and fitted to a logistic growth curve. Sequences and obtained values are listed in Supplementary Table S5. Error bars indicate standard deviation of the median of three measurements of 10 000 events each. (B) Equation describing the logistic fit between predicted folding energy and normalized fluorescence. (C) Diagram of the transcription unit that constitutes the RNA hairpin library. Pink area constitutes the hairpin backbone with red spheres indicating degenerate nucleotides. (D) Correlation between the predicted strength of 5′UTR structure libraries and the measured gene expression distributions of these libraries. All panels show normalized frequency distributions (histograms). A total of six libraries (HL1-6) are shown, whose average MFE of folding is given in kcal/mol. In the top row of panels, the histogram of the distribution of the MFE in the 5′UTRs of the different libraries is shown. The horizontal axes for these panels ranges on a linear scale from −50 kcal/mol to 0 kcal/mol. The middle row converts these into a histogram of predicted normalized expression levels using the equation established in panel A. The third row shows the experimentally obtained distribution of normalized fluorescent reporter expression levels as measured by flow cytometry. In the lower two rows, the horizontal axis corresponds to normalized green fluorescence (a unit-less quantity) ranging on a logarithmic scale from 1 on the left to 1000 on the right.

