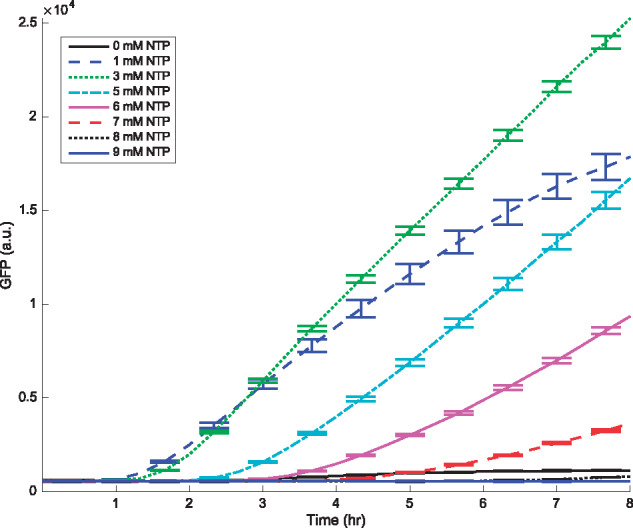
Figure 1.

Translation kinetics demonstrating the GFP protein production for various NTP concentrations with DNA as the starting material. Data are measured every 20 min, while error bars, denoting the standard error of the mean, are plotted for every other data point for clarity. Mean and standard error are calculated over six replicates. Concentrations of Mg2+ and K+ are 18 mM and 91 mM, respectively.
