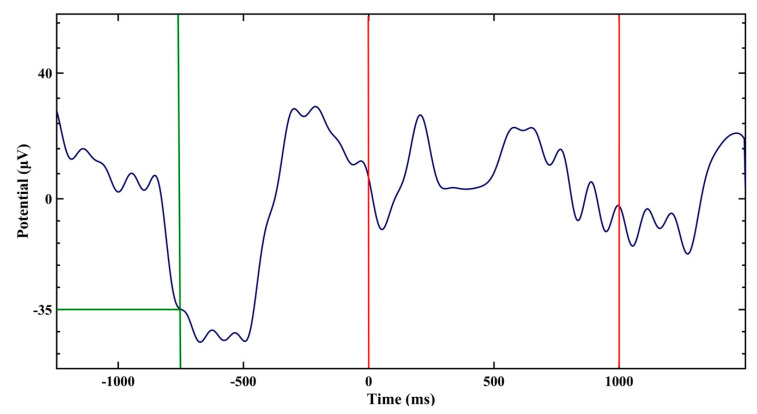
Figure 1.
Schematic presentation of paired stimuli (red lines) programmed to start during stimulation epochs whenever the electroencephalography (EEG) wave crossed an established threshold (−35 µV for representative study participant #9, green lines). After the crossing, the first stimulus (red line at “0” time) in this subject was set to be delivered in 0.5 s (but occurred in 0.75 s in fact, see Section 2 for an explanation) to fall on an up-phase of the slow wave; the second stimulus was set to be delivered 1 s after the first.

