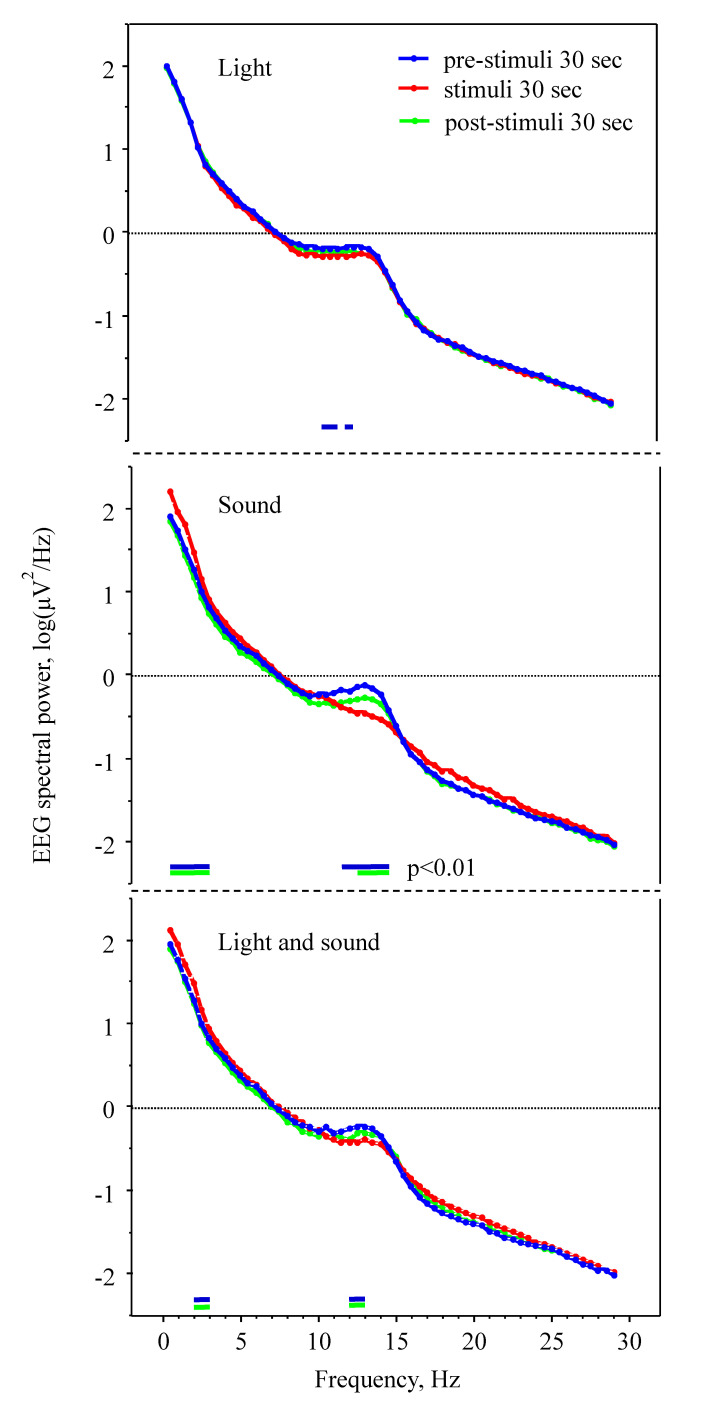
Figure 2.
Effect of visual and/or acoustic stimulation on EEG spectral power density during sleep stage N3 in 9 healthy subjects. Significant differences (p < 0.01, Student’s t-test) are indicated by short lines beneath each diagram (blue line: stimuli vs. pre-stimuli epochs, green line: stimuli vs. post-stimuli epochs).

