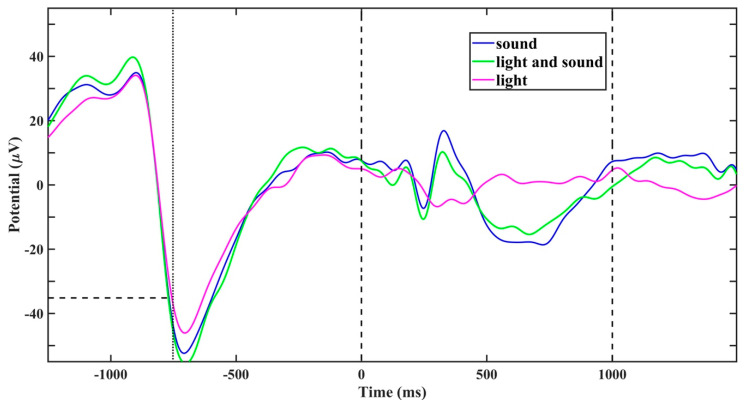
Figure 4.
Average EEG waveforms, referenced to the time of the first (of two paired) stimuli presentation (vertical dashed line at 0 ms), time-locked to the detection of EEG-wave threshold (−35 µV for this representative subject #9; vertical line at −750 ms). The sound and light and sound stimuli evoked distinct event-related potential (ERP) that included all the classic ERP components (P200, N350, P450, N550, and P900 [11,21]).

