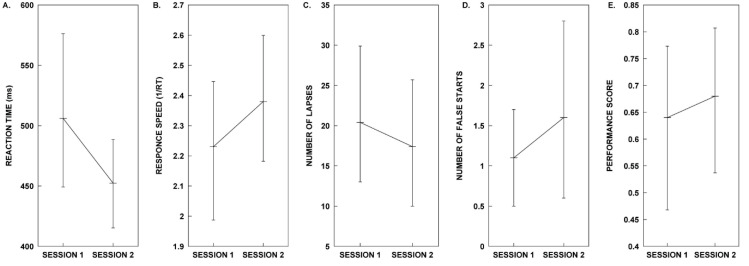
Figure 3.
Results for the five different PVT metrics obtained from participants in Group B during Sessions 1 and 2. (A) Mean reaction time, (B) mean reaction speed, (C) mean number of lapses, (D) mean number of false starts, and (E) mean performance score. All error bars represent 95% confidence intervals. Refer to the Results section for details on the outcome of the statistical analyses.

