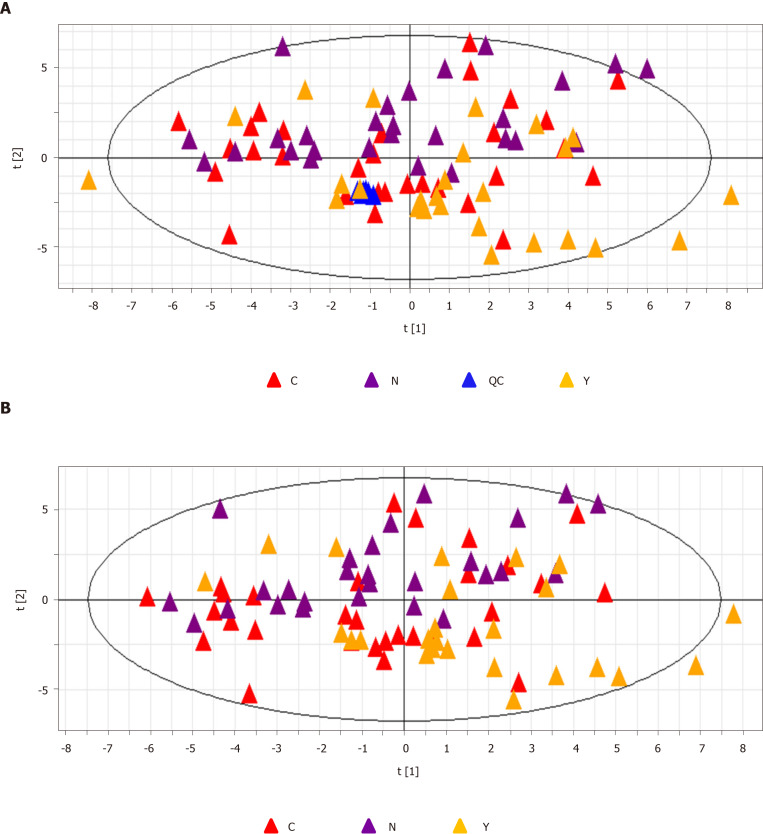
Figure 2.
Principal component analysis. A: The principal component analysis score plot of all samples including quality control samples. R2X = 0.134 cum, Q2 = 0.106 cum; and B: The principal component analysis score plot of all three groups, hepatocellular carcinoma group (C group) cirrhosis group (Y group), and healthy controls (N group). R2X = 0.139 cum, Q2 = 0.103 cum. QC: Quality control; PCA: Principal component analysis; HCC: Hepatocellular carcinoma.

