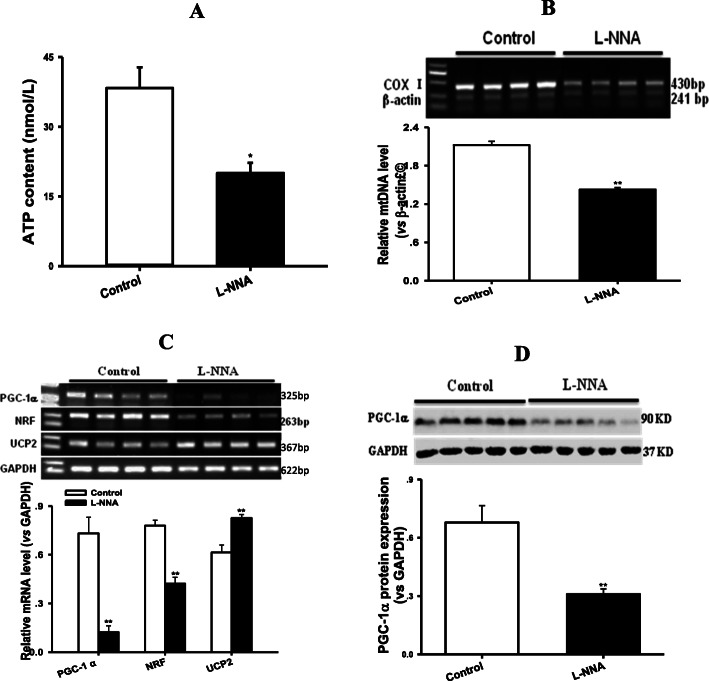
Fig. 6.
Exogenous NOS inhibitor L-NNA suppressed mitochondrial DNA and ATP contents, PGC-1α, NRF and UCP2 transcriptions, and PGC-1α expression in the myocardium of rats. Panel a shows ATP content, panel b represents mitochondrial DNA content, panel c exhibits the relative mRNA levels of PGC-1α, NRF and UCP2, panel d displays the relative protein level of PGC-1α in the myocardium of rats treated with L-Nitro-arginine (L-NNA, 50 mg/Kg/d, i.g.) for 8w, respectively. Graphs in panel b ~ d represent the quantifications of COX I vs β-actin (DNA), PGC-1α or NRF or UCP2 vs GAPDH (mRNA) and PGC-1α vs GAPDH (Protein), respectively. Data are expressed as mean ± S.E.M., n = 4 ~ 5, **P < 0.01 vs Control

