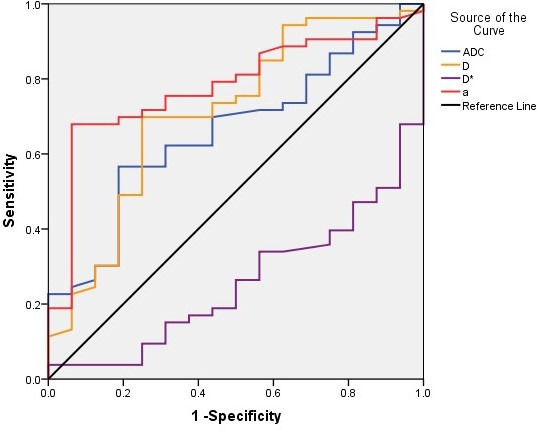
Figure 3.

Sensitivity and specificity curves of quantitative DWI parameters for the differential diagnosis of metastases and myeloma. The area under the curve for α, D, ADC and D* was significantly, whereas that for α was the largest. ADC, apparent diffusion coefficient; DWI, diffusioin-weighted imaging.
