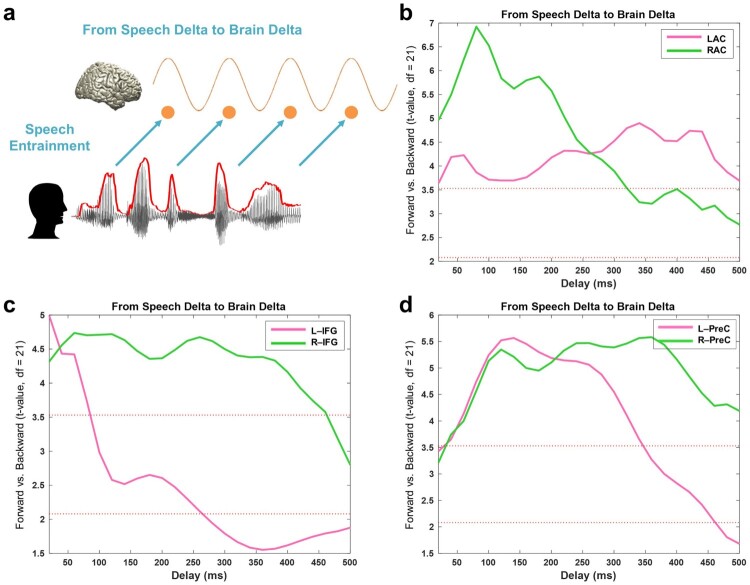
Figure 2.
Entrained brain signals following speech. (a) A schematic figure for directed causal analysis: TE from speech delta phase to brain delta phase (positive delays between speech-brain). TE computation was performed for each condition (forward played and backward played) at each voxel from 20 to 500 ms with a 20-ms step. Orange line represents delta rhythm in the brain and each circle represents a certain point in time. TE values are averaged within each ROI from the AAL atlas and compared statistically between conditions. T-values are shown in each ROI bilaterally (pink: left hemisphere, green: right hemisphere): (b) primary auditory cortex (Heschl gyrus) (c) Inferior frontal gyrus – opercular part (BA44) (d) precentral gyrus. Statistical significance was shown with two red lines depicting t-values by paired t-test (upper red line: t21 = 3.53, p < 0.05, corrected; bottom red line: t21 = 2.08, p < 0.05, uncorrected).

