Figure 1.
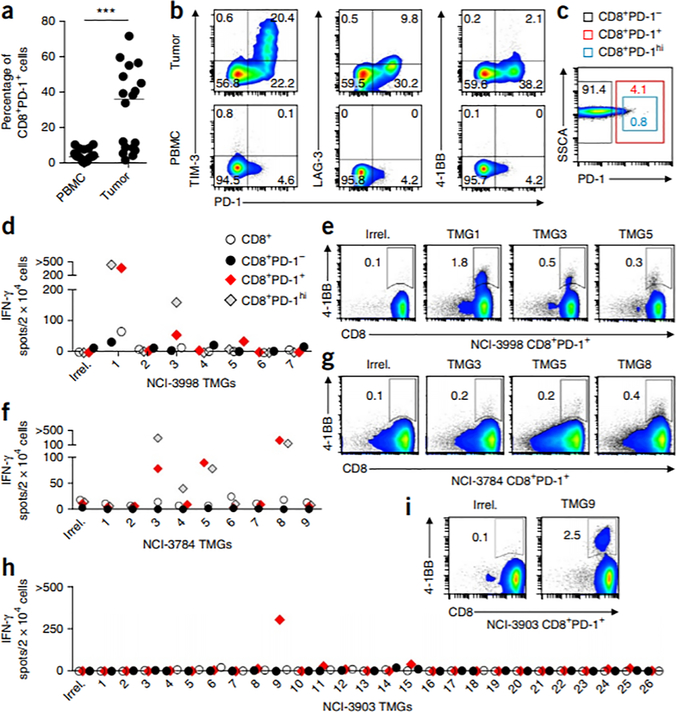
Frequency of PD-1 expression on circulating and tumor-resident CD8+ lymphocytes and prospective identification of circulating neoantigen-reactive cells in melanoma patients. (a) Expression of PD-1 on CD8+ lymphocytes in matched PBMC and tumors (n = 18). The median is plotted. ***P < 0.001; by Mann-Whitney U test. (b) Representative flow cytometry analysis for coexpression of PD-1 and TIM-3 (left), LAG-3 (middle) or 4–1BB (right) on CD8+ lymphocytes in the tumor (top) and PBMC (bottom) from one patient (of n = 18). The percentage of cells expressing each combination of receptors is shown. (c) Image showing gates used for flow cytometry–based sorting of the circulating CD8+ lymphocytes. SSCA, side-scatter area. (d–i) IFN-γ ELISPOT assays (d,f,h) and flow cytometry analysis for 4–1BB expression (e,g,i) showing reactivity of in vitro–expanded subsets (CD8+, CD8+PD-1hi, CD8+PD-1− and CD8+PD-1+) sorted from pretreatment PBMC from patients NCI-3998 (d,e), NCI-3784 (f,g) and NCI-3903 (h,i) to autologous DCs transfected with RNAs encoding an irrelevant TMG (Irrel.) or the indicated TMGs. Representative flow cytometry plots show the percentage of 4–1BB+ lymphocytes after coculture of circulating CD8+PD-1+ cells with the TMGs specified. Plotted cells were gated on live CD3+ lymphocytes. ‘>’ denotes greater than 500 spots/2 × 104 cells. Experiments were performed without duplicates. All data are representative of at least two experiments.

