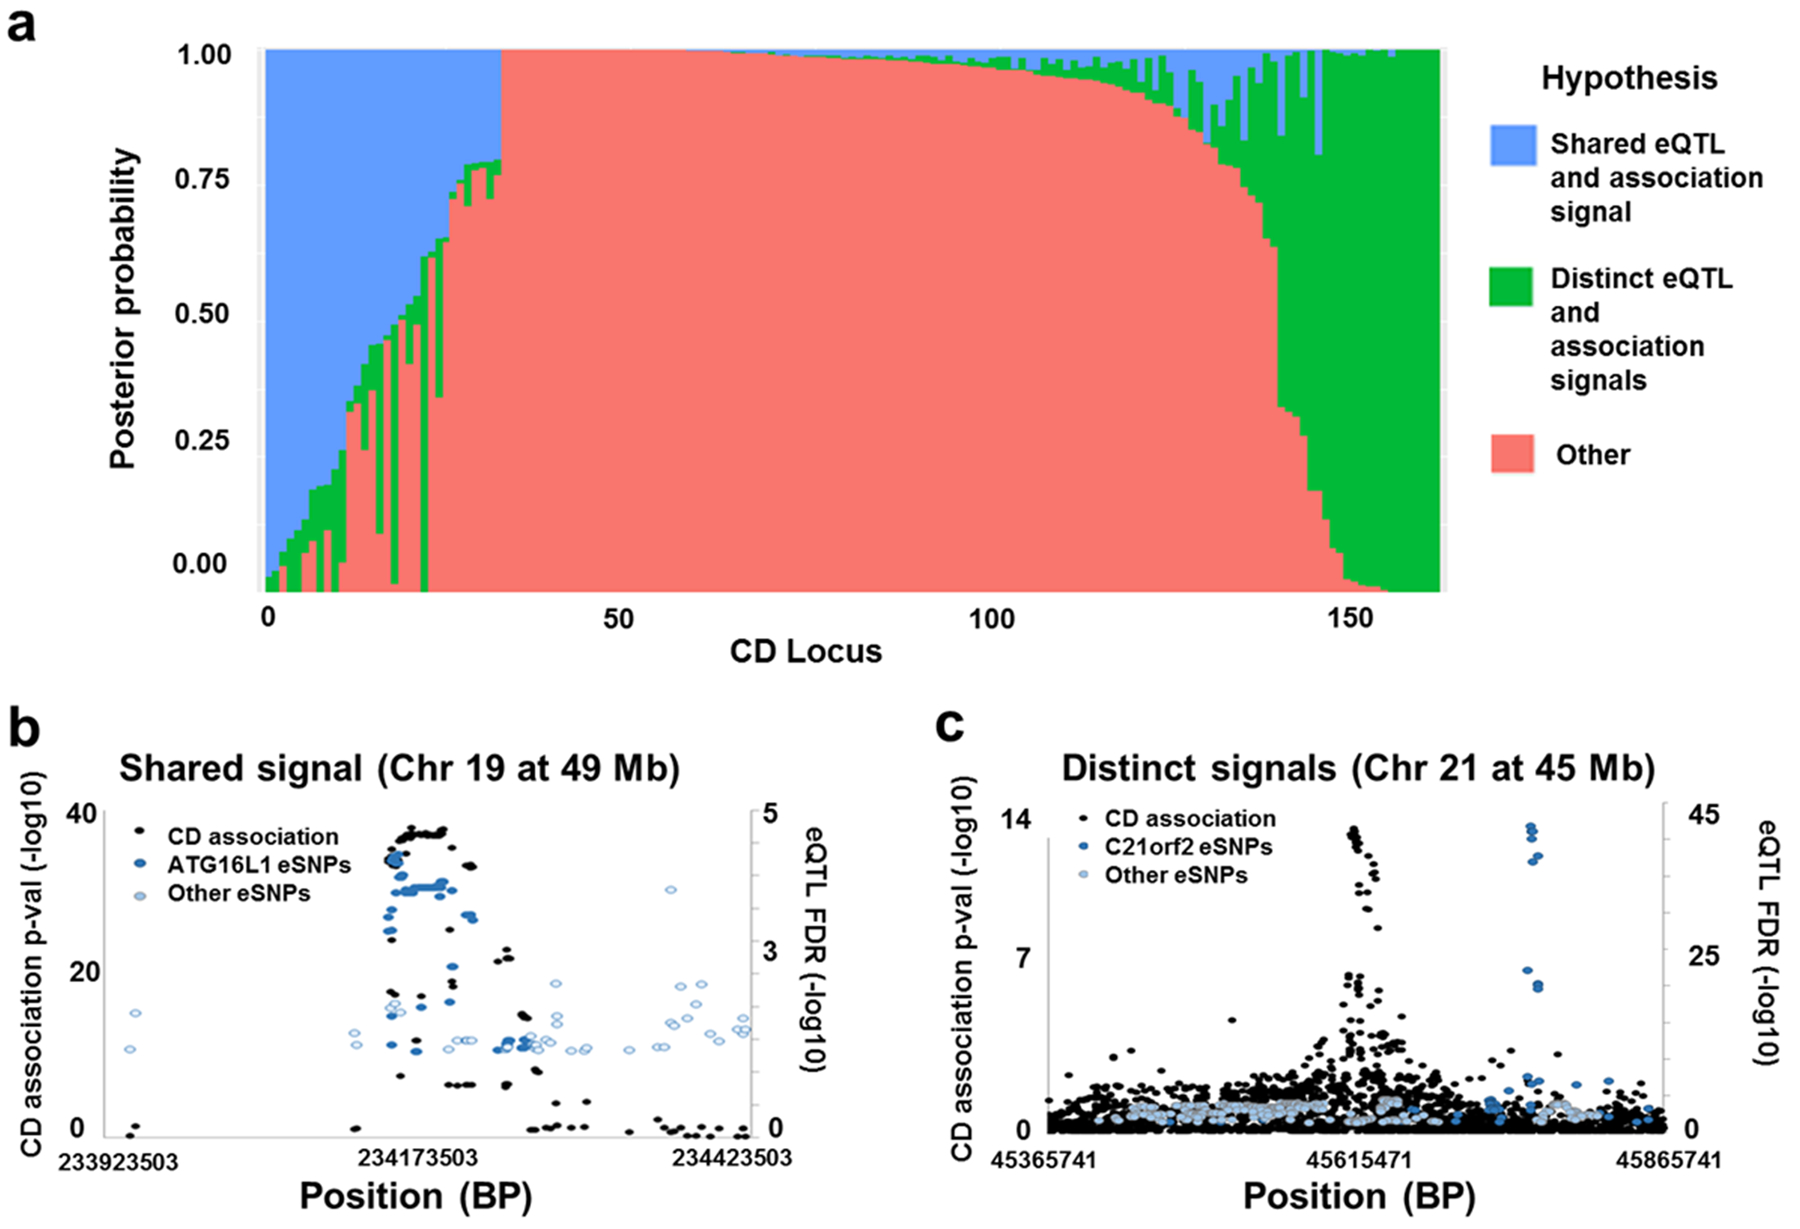
Figure 1:

Measurement of colocalization between CD associations and single-point eQTL in each CD locus. a. Distribution of posterior probability values reported by Coloc across CD loci show that a subset of loci have overlapping signal. Each bar represents a CD locus, while coloration represents the posterior probabilities reported. b. and c. Plots comparing eSNP and CD association p-value peaks in representative loci with high probability of shared signal (b) and distinct signals (c).
