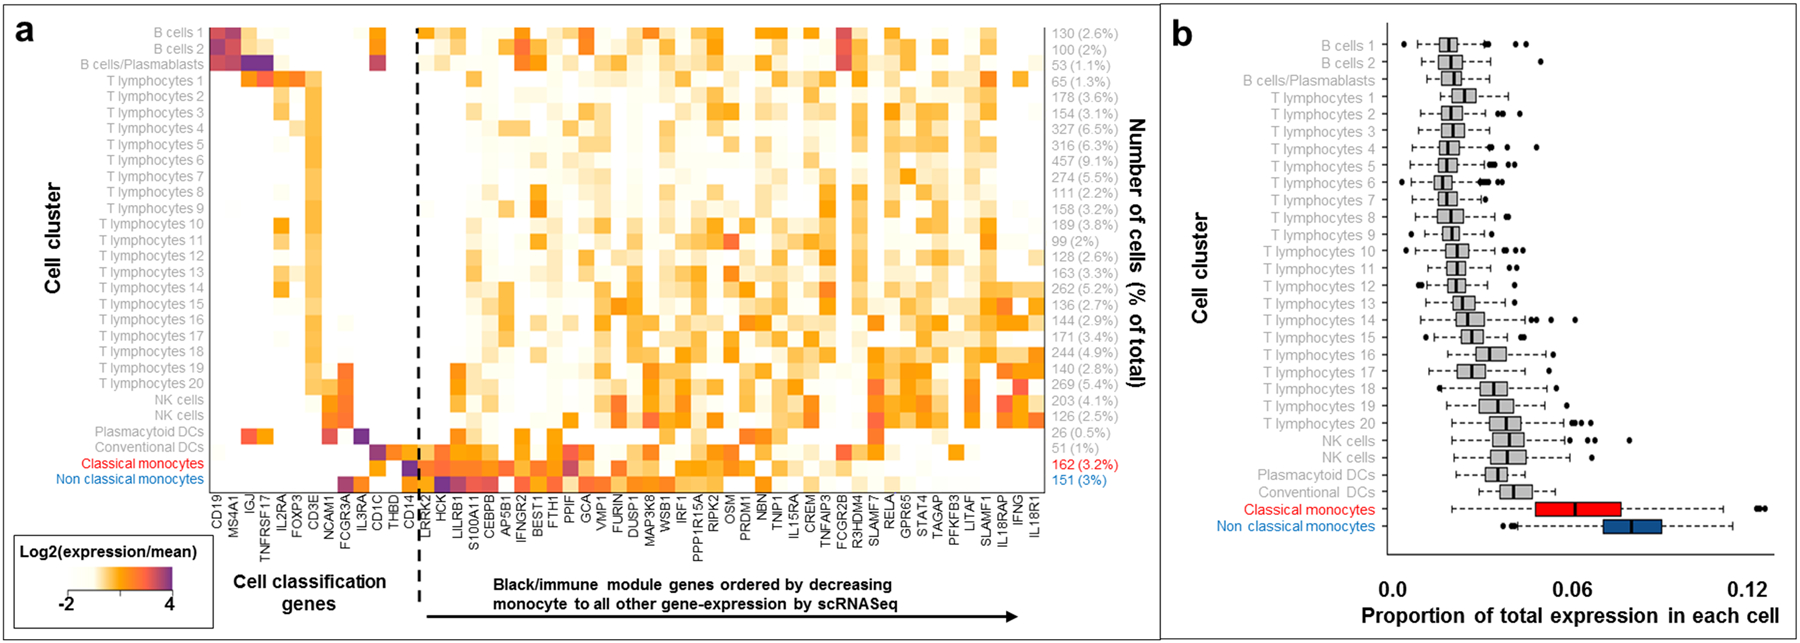
Figure 2:

Single cell mRNA-Seq analyses of black module genes. a. Heatmap showing relative expression values for cell classification genes and black module genes in 5000 PBMC cells. b. Distribution of total UMI proportion corresponding to black module gene expression across cell types.
