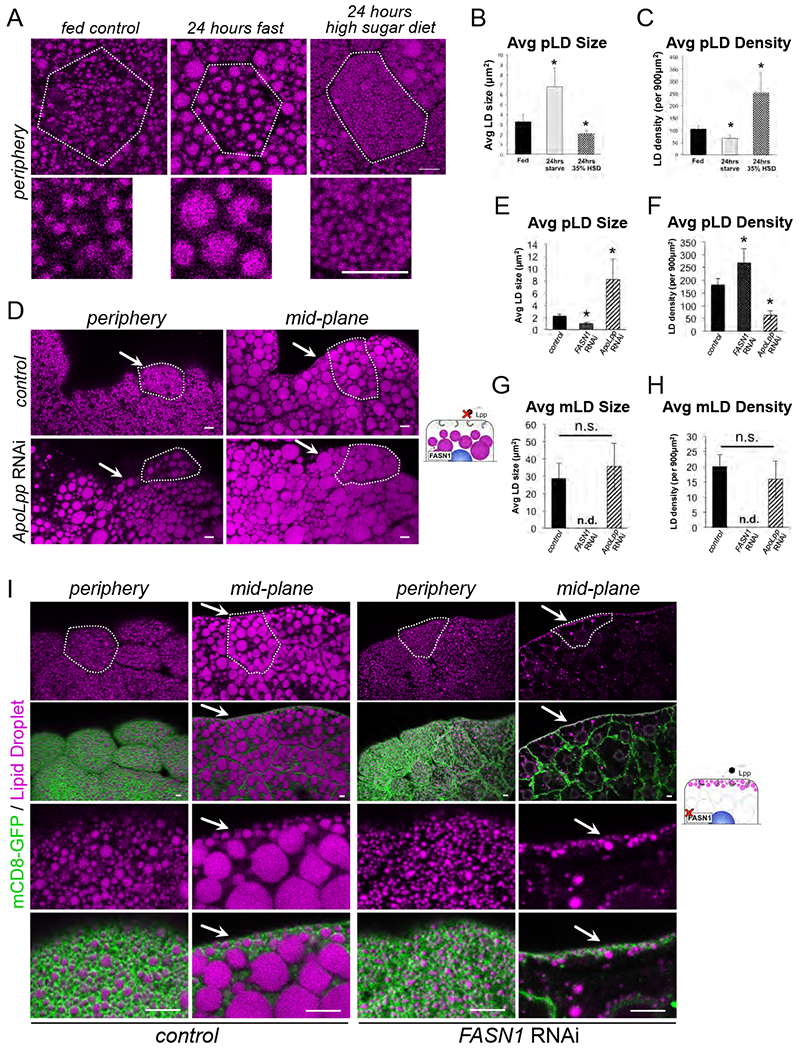
Figure 2: FB pLDs and mLDs are maintained by distinct lipid sources.

A) FB cell peripheries stained for LDs (MDH, magenta) in either fed larvae, 24 hour fasted larvae, or larvae fed a high sugar diet for 24 hours. White outline indicates a single cell boundary. Scale bars 10μm. B) Quantification of average LD size of samples in Panel A. * indicates p<0.05. C) Average LD density for Panel A. * indicates p<0.05. D) FB tissue stained for LDs (MDH, magenta) in either control (Dcg-Gal4) or (Dcg-Gal4>UAS-ApoLppRNAi). Arrows indicate areas the pLDs should reside. Scale bar is 10μm. E) Average pLD size for control (Dcg-Gal4), FASN1RNAi (Dcg-Gal4>UAS-FASN1RNAi), and ApoLppRNAi samples. * indicates p<0.05. F) Average pLD density for samples as in E. G) Average mLD size for control (Dcg-Gal4), FASN1RNAi, and ApoLppRNAi samples. * indicates p<0.05. H) Average mLD density for samples as in G. I) FB stained for LDs (MDH, magenta) and expressing mCD8-GFP PM marker (Dcg-Gal4>UAS-mCD8-GFP) (green). Individual cells are outlined in white. Control (Dcg-Gal4) samples are on the left and FASN1RNAi FB samples are on the right. Arrows indicate the pLD population. Scale bar is 10μm.
