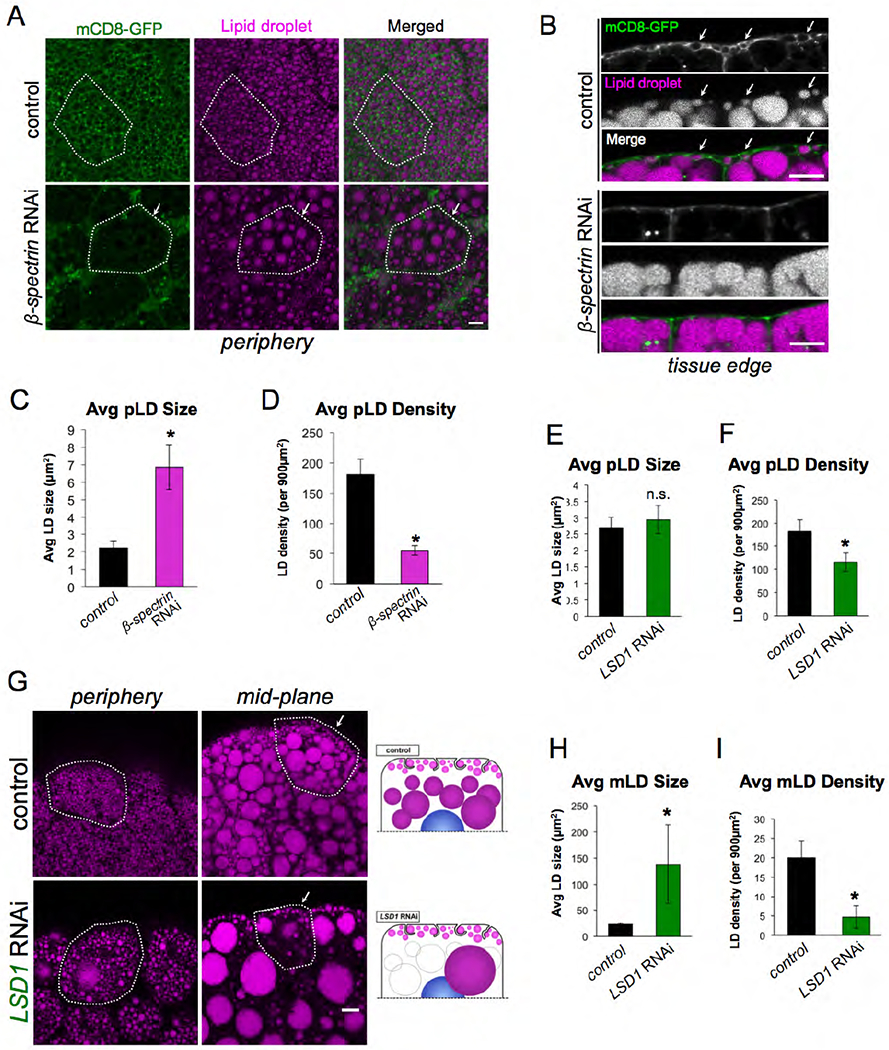
Figure 3: pLD morphology is maintained by β-spectrin and LSD2 but is independent of perilipin LSD1.

A) FB expressing mCD8-GFP PM marker (green) (Dcg-Gal4>UAS-mCD8-GFP) and stained for LDs (MDH, magenta). Tissues are either control (Dcg-Gal4 alone) or β-spectrinRNAi (Dcg-Gal4>UAS-β-spectrinRNAi) in the FB. Individual cells are outlined in white. Arrows indicate a cell with altered pLD morphology. Scale bar is 10μm. B) Side profiles of control and β-spectrinRNAi tissue as in Panel A. White arrows indicate PM-wrapping of pLDs in control, which are missing in B-spectrinRNAi tissue. Scale bar is 10μm. C) Average pLD size in control and β-spectrinRNAi tissue. * indicates p<0.05. D) Average pLD density in control and β-spectrinRNAi tissue. * indicates p<0.05. E) Average pLD size in control (Dcg-Gal4) and LSD1RNAi (Dcg-Gal4>UAS-LSD1RNAi) tissue. F) Average pLD density in control (Dcg-Gal4) and LSD1RNAi tissue. * indicates p<0.05. G) FB stained for LDs (MDH, magenta) of either control (Dcg-Gal4 alone) or LSD1RNAi. Single cells are outlined in white. Arrows indicate the pLD layer. Scale bar is 10μm. H) Average mLD size in control and LSD1RNAi tissue. * indicates p<0.05. I) Average mLD density in control (Dcg-Gal4) and LSD1RNAi tissue. * indicates p<0.05.
