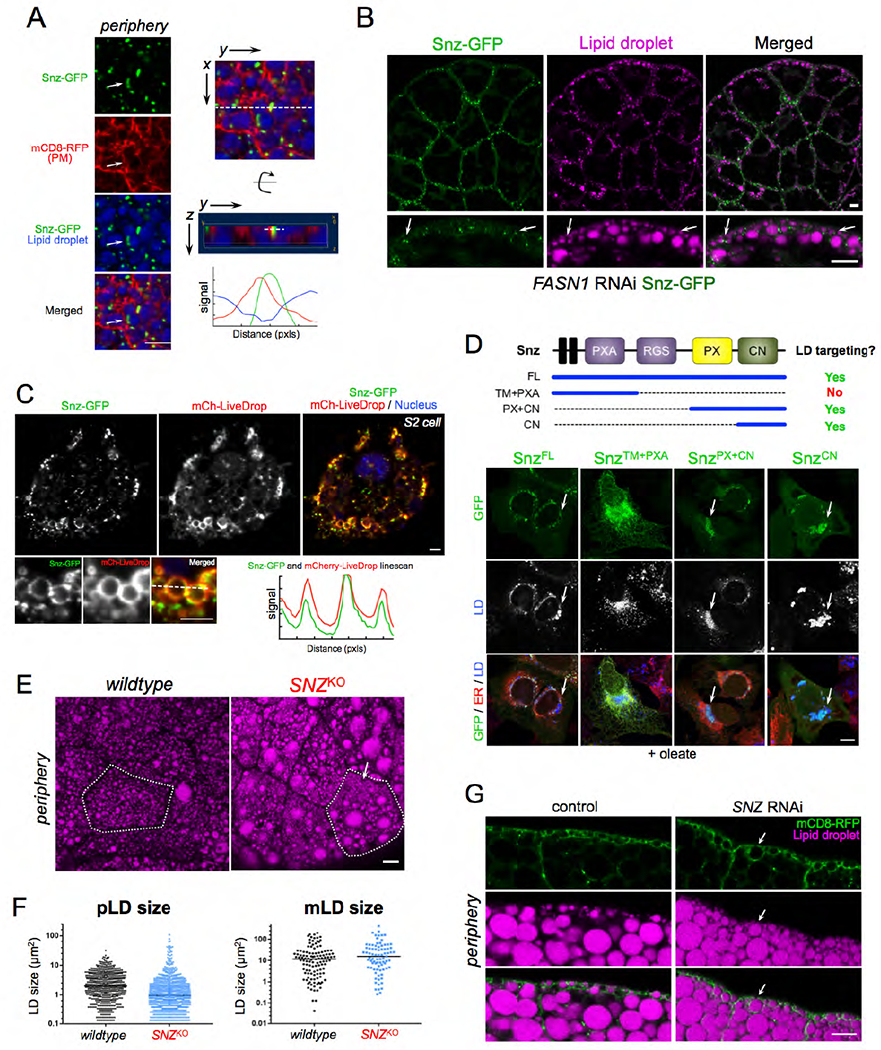
Figure 5: Snz interacts with LDs via its C-Nexin domain and loss of SNZ perturbs LD homeostasis in the FB.

A) FB cell periphery expressing Snz-GFP (green) (Dcg-Gal4>UAS-Snz-GFP), PM marker mCD8-mCherry (red) (Dcg-Gal4>mCD8-mCherry), and stained for LDs (MDH, blue). Arrow indicates a Snz-GFP "cup” that is in close proximity to a pLD and PM structure. Linescan indicated with white line. This region is displayed both from the "top” x,y view as well as "side” y,z view. Scale bar 10μm. B) FASN1RNAi FB (Dcg-Gal4>UAS-FASN1RNAi) expressing Snz-GFP (green) (Dcg-Gal4>UAS-Snz-GFP) and stained for LDs (MDH, magenta). Arrows indicate sites where Snz-GFP forms foci at the cell periphery that associate adjacent to pLDs. Scale bar 10μm. C) Drosophila S2 cell expressing Snz-GFP (green) and LD surface marker mCherry-LiveDrop (mCh-LiveDrop, red) and DAPI stained (blue). Linescan indicated with a white line. Scale bar 10μm. D) Mammalian U2OS cells treated overnight with oleate-conjugated BSA and expressing Snz-GFP fragments as denoted by the schematic at top of Panel. Snz-GFP fragments (green), ER marker is lumenal HSP90B1 (red) and LDs (MDH, blue, white in middle panel). Arrows indicate Snz-GFP targeting to LDs. Scale bar 10μm. E) FB from SNZKO larvae stained for LDs (MDH, magenta). A single cell is outlined in white. Arrow indicates a region of dense small pLDs. Scale bar 10μm. F) Dot plot of individual LD sizes in control w1118 and SNZKO larvae as represented in Panel E. G) FB side profiles of peripheries of control (Dcg-Gal4 alone) and SNZRNAi (Dcg-Gal4>UAS-SNZRNAi) larvae expressing mCD8-GFP PM marker (green) (Dcg-Gal4>UAS-mCD8-mCherry, that is pseudo-colored green here) and stained for LDs (MDH, magenta). Arrows indicate the absence of a clear pLD layer in SNZRNAi larvae. Scale bar 10μm.
