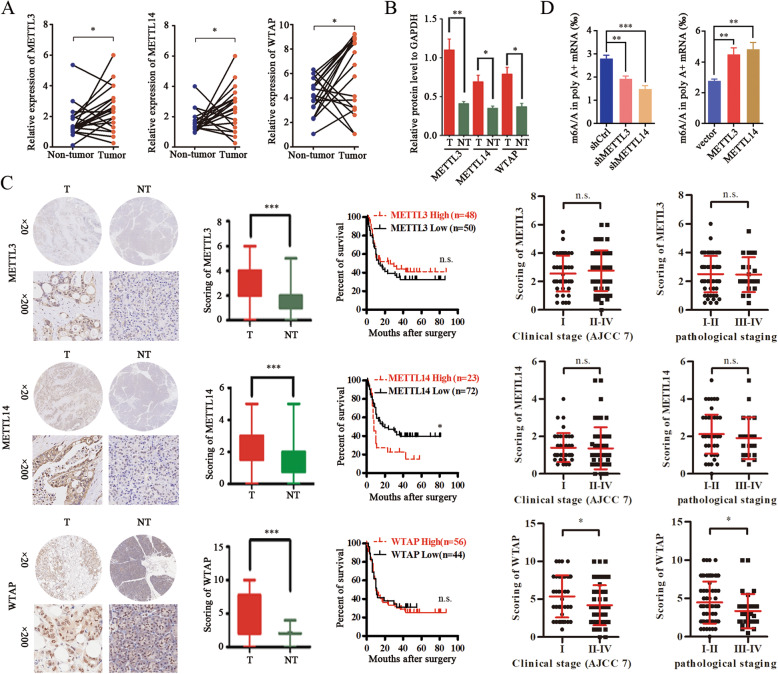
Fig. 2.
Aberrant expression of METTL 3-METTL14 complex in pancreatic cancer. a Real-time PCR analysis of the relative mRNA levels of METTL3, METTL14, and WTAP in 20 paired pancreatic cancer tissues. * p < 0.05. b Quantification of western blot analyses of METTL3, METTL14, and WTAP levels in pancreatic cancer and adjacent tissues. * p < 0.05; ** p < 0.01. c Immunohistochemical analysis of METTL3/METTL14/WTAP expression in pancreatic cancer tissues; Kaplan-Meier analysis of the correlation between METTL3/METTL14/WTAP expression and the overall survival of pancreatic cancer patients; and relative METTL3/METTL14/WTAP expression scores in pancreatic cancer tissues per clinical and pathological stage. * p < 0.05; ***p < 0.001; n.s., no significance. d Colorimetric quantification of m6A in PANC-1 cells after METTL3 and METTL14 knockdown or overexpression. ** p < 0.01; ***p < 0.001

