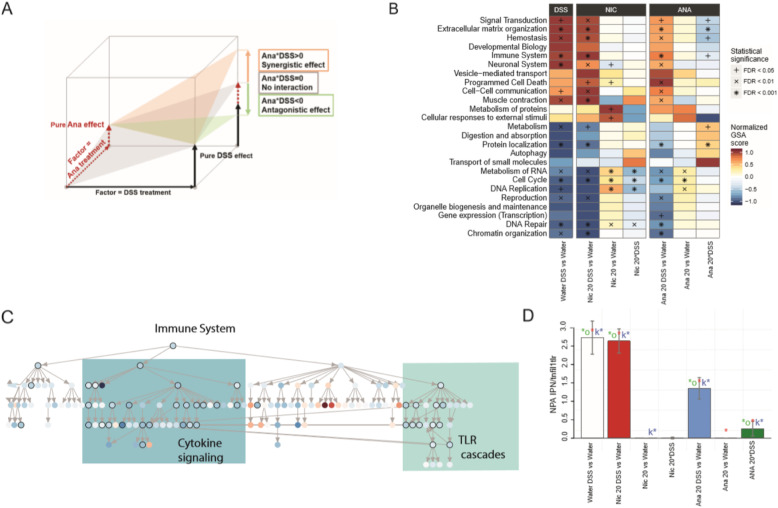
Fig. 3.
Biological interpretation of the transcriptomics results. a Schematic representation of the effects of anatabine/nicotine exposure as a modification of the pure DSS effect. The measured combined “anatabine/nicotine DSS” effect (captured by the pairwise comparisons “anatabine/nicotine DSS vs Water”) can be viewed as the sum of the pure effects of the two factors “DSS treatment” and “anatabine/nicotine exposure”, together with the adjusting two-factor interaction term “anatabine/nicotine*DSS”. Anatabine/nicotine exposure is synergistic with DSS treatment if the interaction term has the same sign as the pure DSS effect (e.g., both are positive, as in the schema); in contrast, the relationship is antagonistic if the interaction term has an opposite sign to the pure DSS effect. b GSA results for the top 25 Reactome pathway categories. The heatmap displays the GSA scores (normalized row-wise to their maximum absolute values) as well as their competitive Q1 statistical significance. The FDRs were calculated only among the top 25 Reactome pathway categories, which are sufficiently distinct in their gene content to assume independence of their enrichment results. c Hierarchical representation of the GSA results for all pathways contained in the top Reactome “Immune System” category and for the two-factor “Ana 20*DSS” interaction. The color map corresponds to the normalized GSA scores contained in the interval [− 1,1], whereas their statistical significance (competitive Q1 p values ≤0.05) is indicated by black circles around the nodes. The actual labels of the nodes (i.e., the Reactome pathway names) can be found in Online Resource 5. The tree-like structure of the Reactome pathway collection enables top-down investigation within the relevant pathway categories by identifying increasingly specific biological processes (i.e., involving fewer and fewer genes) along the longest paths connecting the statistically significant pathways. d NPA results for the TLR–IL1R–TNFR network model. The bar plot displays the NPA values for the selected contrasts, and their statistical significance is indicated by the three colored asterisks. Note that, by definition, the positive NPA values depend on the square of the input gene-level fold changes and, therefore, might amplify the differences between the contrasts without preserving the additive relationships among them. Nic 5, nicotine 5 mg/kg; Nic 20, nicotine 20 mg/kg; Ana 5, anatabine 5 mg/kg; Ana 20, anatabine 20 mg/kg

