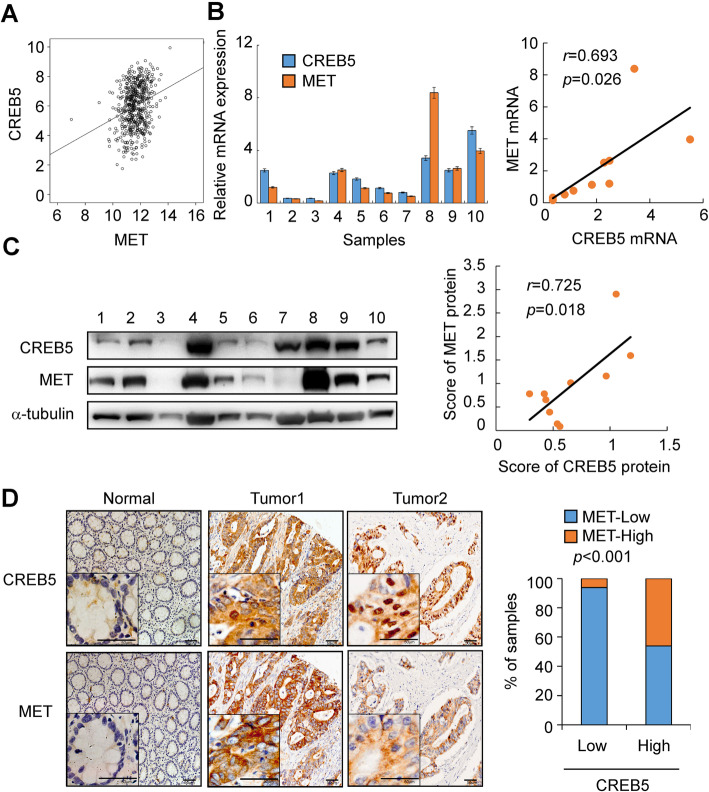
Fig. 6.
CREB5 positively correlated with MET expression in CRC. a Correlation analysis of CREB5 and MET in TCGA CRC data (r = 0.260, p < 0.001). b and c Correlation analysis of CREB5 and MET at the mRNA (r = 0.693, p = 0.026) and protein levels (r = 0.725, p = 0.018) in 10 fresh CRC tissues. d The expression of CREB5 and MET protein in specimens, including 78 colon cancer tissue specimens and 2 adjacent normal tissue specimens, was detected by IHC. Representative IHC images (left) and correlation analysis (right) of CREB5 and MET expression. Scale bar: 50 μm. High expression of CREB5: n = 73 (high expression of MET: n = 52). Low expression of CREB5: n = 5 (low expression of MET: n = 4) (p < 0.001)

