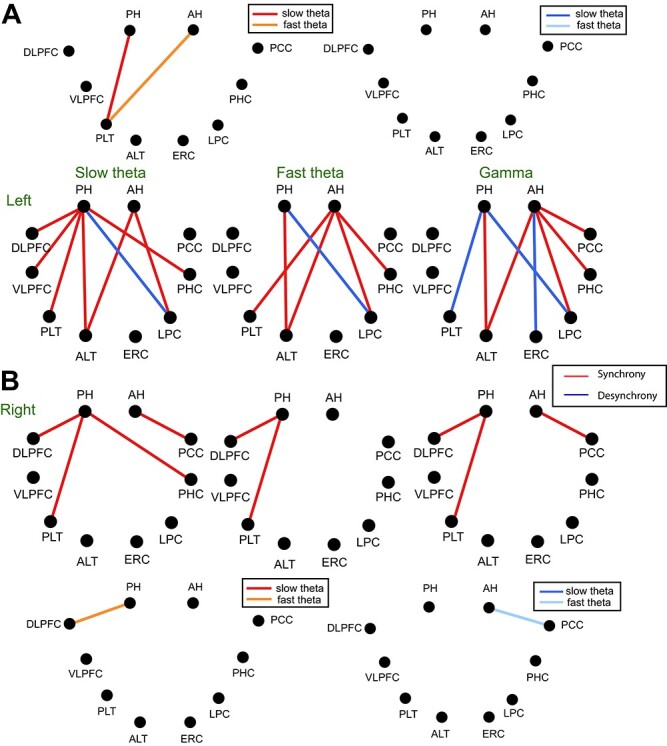
Figure 3 .

Functional connections of slow theta, fast theta, and gamma bands during item encoding for anterior and posterior hippocampus. (A) Results for left hemisphere. Upper figure shows the comparison between slow and fast theta band. The connectivity of slow theta is compared with that of fast theta in each region during encoding. Synchronous connectivity is shown in hot colors (red, orange), and desynchrous connectivity in cold colors (blue, light blue). Only the connections are shown when P-value is less than 0.05 with paired t test. In synchrous connectivity, slow theta is represented with red, and fast theta shown with orange. In desynchrous connectivity, slow theta is shown with blue, and fast theta represented with light blue. In the lower figure, red color indicates greater increased connectivity for successful encoding and blue color shows decreased connectivity. When breaking down connections by band, there are no significant differences between anterior and posterior, although all three bands exhibit stronger posterior than anterior connectivity in the right hemisphere, consistent with the aggregate results shown above. (B) Results for right hemisphere.
