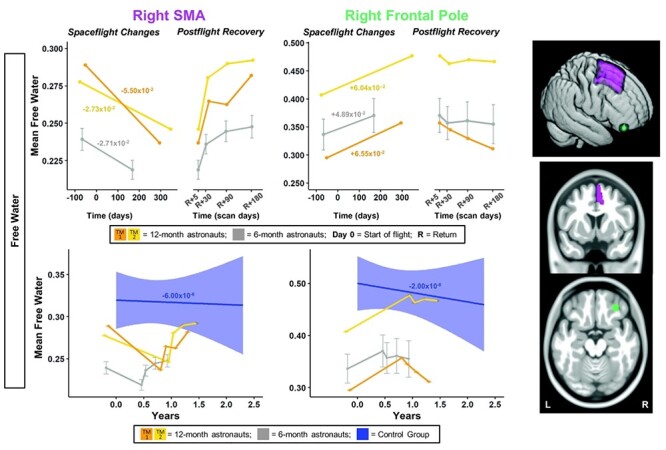
Figure 4 .

SMA and frontal pole FW changes with spaceflight and aging. Twelve-month astronaut data are shown in orange (TM-1) and yellow (TM-2). Six-month astronaut data are shown in gray. Control data are shown in blue. FW is expressed as mean FW fraction change per year. Top: Numeric values in the left “Spaceflight Changes” panels indicate slope of change in units of mean FW fraction per year. For the 6-month group, these slopes are the group median slope. Error bars indicate standard error. Bottom: The average FW change over time for the control participants is indicated by the blue line with blue 95% confidence interval. The control group median slope is indicated in blue text. Error bars indicate standard error. While the T1 control scans were collected over an average of 7.2 ± 1.5 years, the x-axis here only continues out to 2.75 years in order to provide better visual comparison with the astronaut data. ROI Image: Structural ROIs are overlaid onto slices and a rendered template brain in standard space.
