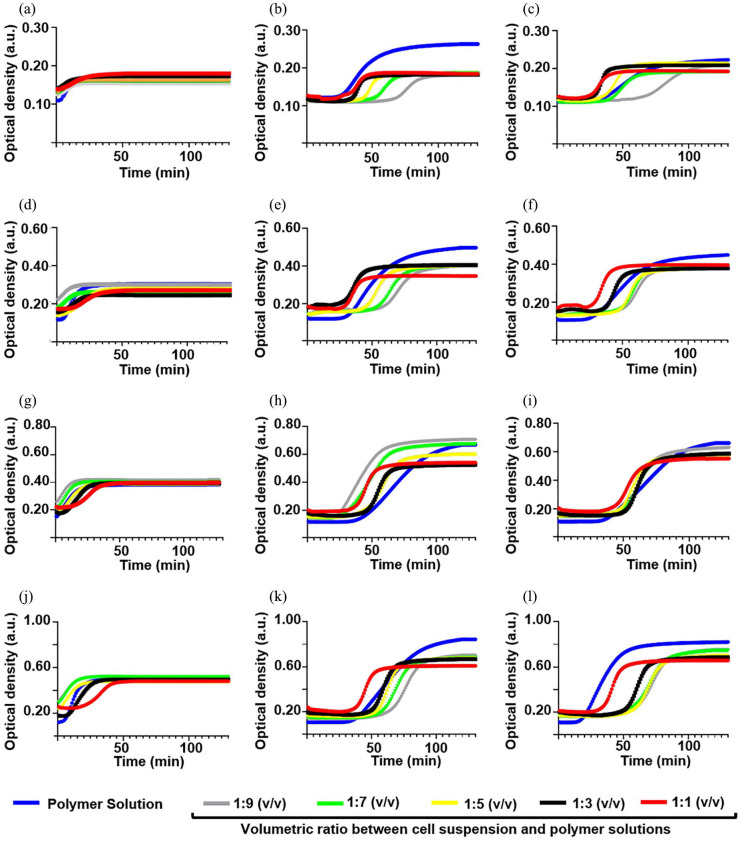
Figure 5.
Turbidity curves of type I collagen fiber self-assembly in vitro for embedded conditions (1 × 10⁵ cells/sample) as a function of thickness and volumetric ratio between cell suspension and polymer solutions. We averaged six replicates/group and showed the mean curves. Curves for 1.25-mm-thick (a) COLL-HA, (b) COLL-PEG2000, and (c) COLL-PEG3350 gels; curves for 2.50-mm-thick (d) COLL-HA, (e) COLL-PEG2000, and (f) COLL-PEG3350 gels; curves for 3.95-mm-thick (g) COLL-HA, (h) COLL-PEG2000, and (i) COLL-PEG3350 gels; curves for 5.10 mm-thick (j) COLL-HA, (k) COLL-PEG2000, and (l) COLL-PEG3350 gels.

