Figure 2.

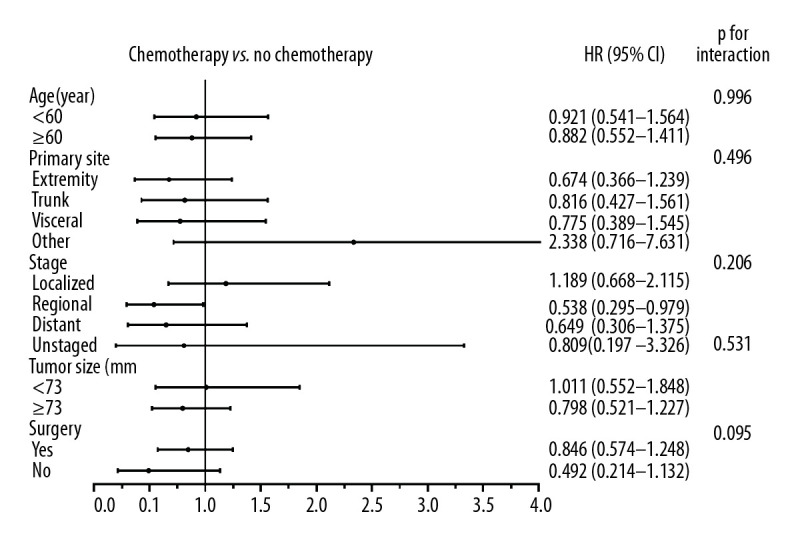
Forest plot representing the hazard ratio (HR) and 95% confidence interval (CI) of overall survival in patients treated with and without chemotherapy in subgroup analysis.

Forest plot representing the hazard ratio (HR) and 95% confidence interval (CI) of overall survival in patients treated with and without chemotherapy in subgroup analysis.