
Figure 2.
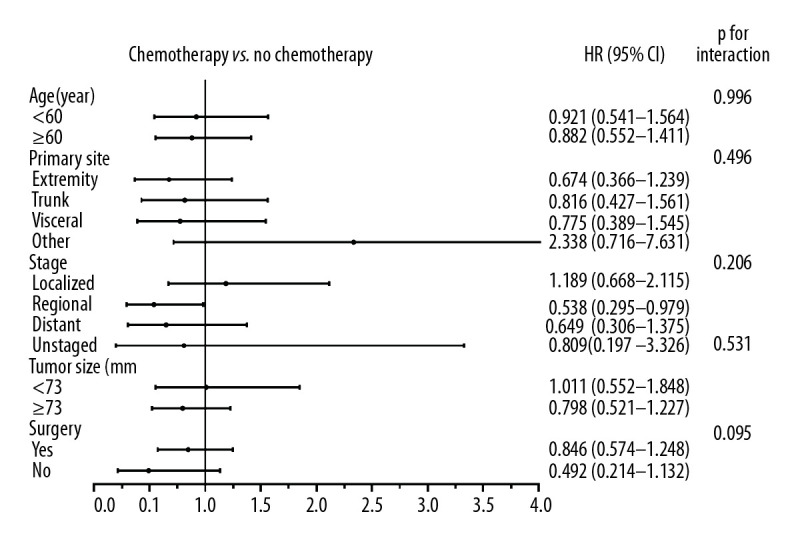
Forest plot representing the hazard ratio (HR) and 95% confidence interval (CI) of overall survival in patients treated with and without chemotherapy in subgroup analysis.
Official websites use .gov
A
.gov website belongs to an official
government organization in the United States.
Secure .gov websites use HTTPS
A lock (
) or https:// means you've safely
connected to the .gov website. Share sensitive
information only on official, secure websites.
Forest plot representing the hazard ratio (HR) and 95% confidence interval (CI) of overall survival in patients treated with and without chemotherapy in subgroup analysis.